Advertisements
Advertisements
प्रश्न
Figure shows the velocity-time graphs for two objects A and B moving in same direction . Which object has the greater a cceleration?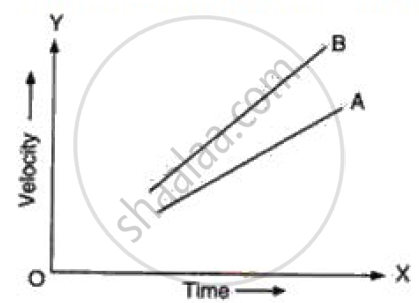
Advertisements
उत्तर
As acceleration is the slope of line in velocity time graph and as B has greater slope than line A.
So B has greater acceleration than A.
APPEARS IN
संबंधित प्रश्न
Name the two quantities, the slope of whose graph give acceleration.
The velocity-time graph for part of a train journey is a horizontal straight line. What does this tell you about the trains velocity.
Show by using the graphical method that: `s=ut+1/2at^2` where the symbols have their usual meanings.
What can you say about the motion of a body if:
its displacement-time graph is a straight line ?
What does the area of an acceleration – time graph represent?
Multiple choice Question. Select the correct option.
In the velocity-time graph, the acceleration is
Draw velocity – time graph for the following situation:
When a body, is moving with uniform velocity.
A train starting from rest picks up a speed of 20 ms−1 in 200 s. It continues to move at the same rate for the next 500 s and is then brought to rest in another 100 s.
- Plot a speed-time graph.
- From graph calculate
(a) uniform rate of acceleration
(b) uniform rate of retardation
(c) total distance covered before stopping
(d) average speed.
From the velocity – time graph given below, calculate Distance covered in the region ABCE.

Draw distance-time graph to show:
Decreasing velocity
