Advertisements
Advertisements
प्रश्न
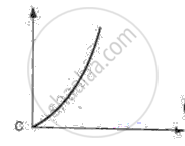
The area under velocity – time graph represents the ______
विकल्प
velocity of the moving object.
displacement covered by the moving object.
speed of the moving object.
acceleration of the moving object
Advertisements
उत्तर
The area under velocity – time graph represents the displacement covered by the moving object.
Explanation:
The area under a velocity-time graph represents the displacement of the moving object. This is because:
Displacement = Velocity × Time
In a velocity-time graph, the product of velocity and time is graphically represented by the area under the curve.
APPEARS IN
संबंधित प्रश्न
What can you say about the motion of a body if:
its displacement-time graph is a straight line ?
For uniform motion _________
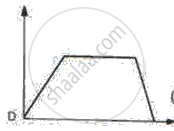
From the velocity – time graph given below, calculate Distance covered in the region ABCE.

How does the slope of a speed-time graph give the acceleration of a body moving along a straight line?
Draw the following graph:
Distance versus time for a body at rest.
Given below are the speed -time graphs. Match them with their corresponding motions :
 |
(a) Uniformity retared motion |
 |
(b) Non-uniformity acceleration |
 |
(c) Non-uniform motion |
 |
(d) uniform motion |
What does the slope of speed-time graph indicate?
Its time-displacement graph is a straight line.
Draw velocity-time graph to show:
Acceleration
Write a sentence to explain the shape of graph.
The slope of the speed–time graph gives ______.
