Advertisements
Advertisements
Question
The graph of one quantity versus another result in a straight line. How are the quantities related to each other?
Advertisements
Solution
Two quantities are directly proportional to each other.
APPEARS IN
RELATED QUESTIONS
The velocity-time graph for part of a train journey is a horizontal straight line. What does this tell you about the trains velocity.
What type of motion is represented by the following graph ?
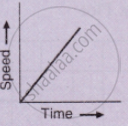
Diagram shows a velocity – time graph for a car starting from rest. The graph has three sections AB, BC, and CD.

In which section, car has a zero acceleration?
A train starting from rest picks up a speed of 20 ms−1 in 200 s. It continues to move at the same rate for the next 500 s and is then brought to rest in another 100 s.
- Plot a speed-time graph.
- From graph calculate
(a) uniform rate of acceleration
(b) uniform rate of retardation
(c) total distance covered before stopping
(d) average speed.
A ball is thrown up vertically and returns back to thrower in 6 s. Assuming there is no air friction, plot a graph between velocity and time. From the graph calculate
- deceleration
- acceleration
- total distance covered by ball
- average velocity.
Diagram is given below shows velocity – time graph of car P and Q, starting from the same place and in the same direction. Calculate at what time intervals both cars have the same velocity?

Diagram is given below shows velocity – time graph of car P and Q, starting from the same place and in the same direction. Calculate which car is ahead after 10 s and by how much?
Interpret the following graph: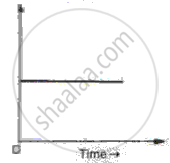
Draw distance-time graph to show:
Increasing velocity
The given graph shows the variation of velocity (v) with position (x) for a particle moving along a straight line
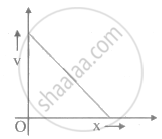
Which of the following graph shows the variation of acceleration (a) with position (x)?
