Advertisements
Advertisements
Question
Diagram is given below shows velocity – time graph of car P and Q, starting from the same place and in the same direction. Calculate which car is ahead after 10 s and by how much?

Advertisements
Solution

Distance covered by car P = area of ΔOAB
= `1/2xx"OB"xx"AB"`
= `1/2xx10xx35`
= 175 m
Distance covered by car Q = area of ΔCDE + area of rectangle DFBE
= `1/2xx"CE"xx"DE"+"EB"xx"BF"`
= `1/2xx(5-2)xx25+(10-5)xx25`
= `75/2+125`
= 37.5 + 125
= 162.5 m
So, car P is a head of car Q by (175 − 162.5) m
i.e. by 12.5 m
APPEARS IN
RELATED QUESTIONS
Derive the following equation of motion by the graphical method : v2 = u2 + 2as, where the symbols have their usual meanings.
A body with an initial velocity x moves with a uniform acceleration y. Plot its velocity-time graph.
Study the speed-time graph of a car given alongside and answer the following questions:
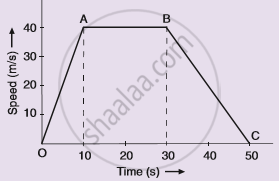
(i) What type of motion is represented by OA ?
(ii) What type of motion is represented by AB ?
(iii) What type of motion is represented by BC ?
(iv) What is the acceleration of car from O to A ?
(v)What is the acceleration of car from A to B ?
(vi) What is the retardation of car from B to C ?
Multiple choice Question. Select the correct option.
A graph is a straight line parallel to the time axis in a distance-time graph. From the graph, it implies:
Represent the location of an object described as at 15 m, 45o west of north, on a graph paper.
How will you use a speed-time graph to find whether the acceleration of the body is uniform or not?
Draw the following graph:
Distance versus time for a body at rest.
What can you say about the nature of motion of a body of its displacement-time graph is:
A straight line inclined to the time axis with an acute angle?
Saphira moves at a constant speed in the same direction. Rephrase the same sentence in fewer words using concepts related to motion.
State whether true or false. If false, correct the statement.
If the velocity – time graph of a particle is a straight line inclined to X-axis then its displacement – time graph will be a straight line.
