Advertisements
Advertisements
Question
Three speed-time graphs are given below :
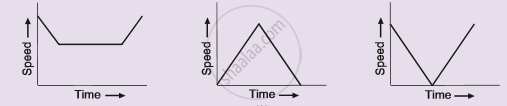
Which graph represents the case of:
(i) a cricket ball thrown vertically upwards and returning to the hands of the thrower ?
(ii) a trolley decelerating to a constant speed and then accelerating uniformly ?
Advertisements
Solution
(i) Graph (c) represents a cricket ball thrown vertically upwards and returning to the hands of the thrower.
(ii) Graph (a) represents a trolley decelerating to a constant speed and then accelerating uniformly.
APPEARS IN
RELATED QUESTIONS
What does the slope of velocity-time graph represent?
Diagram shows a velocity – time graph for a car starting from rest. The graph has three sections AB, BC and CD.

From a study of this graph, state how the distance travelled in any section is determined.
How will you use a speed-time graph to find whether the acceleration of the body is uniform or not?
The graph of one quantity versus another result in a straight line. How are the quantities related to each other?
Draw the following graph:
Speed versus time for a uniformly retarded motion.
Derive the equation
S = ut+ `1/2` at2
Using a speed- time graph
Draw the distance-time graphs of the bodies P and Q starting from rest, moving with uniform speeds with P moving faster than Q.
Figure shows the distance-time graph of three students A, B and C. On the basis of the graph, answer the following :
Will the three ever meet at any point on the road?
State whether true or false. If false, correct the statement.
If the velocity – time graph of a particle is a straight line inclined to X-axis then its displacement – time graph will be a straight line.
The velocity-displacement graph describing the motion of a bicycle is shown in the figure.

The acceleration-displacement graph of the bicycle's motion is best described by:
