Advertisements
Advertisements
Question
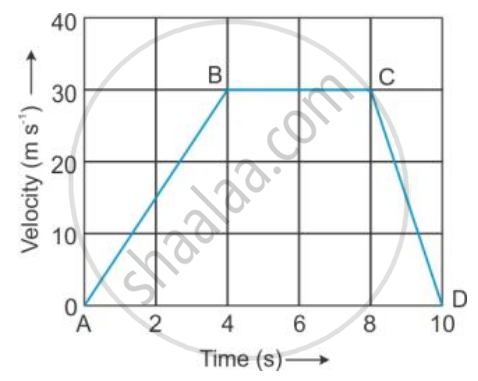
The graph given alongside shows how the speed of a car changes with time:
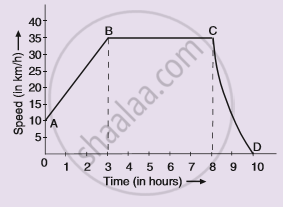
(i) What is the initial speed of the car ?
(ii) What is the maximum speed attained by the car ?
(iii) Which part of the graph shows zero acceleration ?
(iv) Which part of the graph shows varying retardation ?
(v) Find the distance travelled in first 8 hours.
Advertisements
Solution
(i) Initial speed of the car is 10 km/h
(ii) Maximum speed attained by the car is 35km/h
(iii) BC represents zero acceleration.
(iv) CD represents varying retardation.
(v) Distance travelled is given by the area enclosed within the curve. So,
Distance travelled = Area or trapezium + Area of rectangle
So distance travelled,
= (1/2)(8+5)(25) + (8)(10)
= 242.5 km
APPEARS IN
RELATED QUESTIONS
What does the path of an object look like when it is in uniform motion?
Change the speed of 6 m/s into km/h.
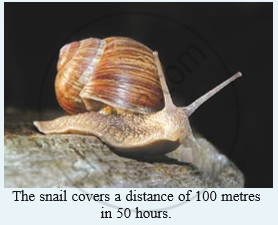
A snail covers a distance of 100 metres in 50 hours. Calculate the average speed of snail in km/h.
A car travels 100 km at a speed of 60 km/h and returns with a speed of 40 km/h. Calculate the average speed for the whole journey.
Give one example of a motion where an object does not change its speed but its direction of motion changes continuously.
The tip of seconds’ hand of a dock takes 60 seconds to move once on the circular dial of the clock. If the radius of the dial of the clock be 10.5 cm, calculate the speed of the tip of the seconds’ hand of the clock. `("Given" π= 22/7)`.
Which of the following can sometimes be 'zero' for a moving body?
(i) average velocity
(ii) distance travelled
(iii) average speed
(iv) displacement
What do you mean by motion in one direction?
The speed of a car is 72 km h-1. Express it in m s-1.
The velocity-time graph of a moving body is given below in Figure
Total displacement.
