Advertisements
Advertisements
प्रश्न
State whether true or false. If false, correct the statement.
The velocity – time graph of a particle falling freely under gravity would be a straight line parallel to the x axis.
पर्याय
True
False
Advertisements
उत्तर
False,
Correct statement: The velocity time graph of a particle falling freely under gravity would be a straight line perpendicular to the x axis.
APPEARS IN
संबंधित प्रश्न
What is the quantity which is measured by the area occupied below the velocity-time graph?
A body is moving uniformly in a straight line with a velocity of 5 m/s. Find graphically the distance covered by it in 5 seconds.
Study the speed-time graph of a car given alongside and answer the following questions:
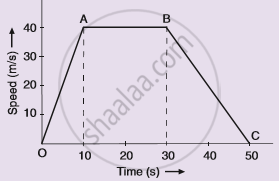
(i) What type of motion is represented by OA ?
(ii) What type of motion is represented by AB ?
(iii) What type of motion is represented by BC ?
(iv) What is the acceleration of car from O to A ?
(v)What is the acceleration of car from A to B ?
(vi) What is the retardation of car from B to C ?
Multiple choice Question. Select the correct option.
The distance covered in the adjoining velocity-time graph is :
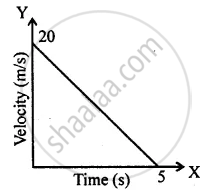
Diagram shows a velocity – time graph for a car starting from rest. The graph has three sections AB, BC, and CD.

Is the magnitude of acceleration higher or lower than that of retardation? Give a reason.
Figure shows the velocity-time graphs for two objects A and B moving in same direction . Which object has the greater a cceleration?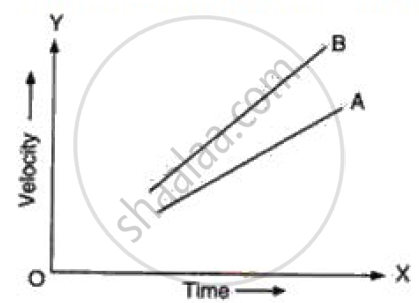
Derive the equation
S = ut+ `1/2` at2
Using a speed- time graph
Saphira moves at a constant speed in the same direction. Rephrase the same sentence in fewer words using concepts related to motion.
The area under velocity – time graph represents the ______
From the v-t graph, ______ can be calculated.
