Advertisements
Advertisements
प्रश्न
From the velocity – time graph given below, calculate Average velocity in region CED.

Advertisements
उत्तर
Displacement covered in region ΔCDE = area of ΔCDE
= `1/2xx"ED"xx"CE"`
= `1/2xx(28-16)xx6`
= `1/2xx12xx6`
= 36 m
Average velocity in region CED = `"Total displacement"/"Time"`
= `36/12`
= 3 ms−1
APPEARS IN
संबंधित प्रश्न
A car of mass 1000 kg is moving with a velocity of 10 m s−1. If the velocity-time graph for this car is a horizontal line parallel to the time axis, then the velocity of car at the end of 25 s will be :
What does the slope of a displacement-time graph represent?
From the velocity – time graph given below, calculate acceleration in the region AB.
Draw the speed-time graph of a body starting from some point P, gradually picking up speed, then running at a uniform speed and finally slowing down to stop at some point Q.
Draw the following graph:
Speed versus time for a non-uniform acceleration.
Draw distance-time graph to show:
Increasing velocity
Draw distance-time graph to show:
Uniform velocity
What does the slope of velocity-time graph represent?
Figure shows the velocity-time graphs for two objects A and B moving in same direction . Which object has the greater a cceleration?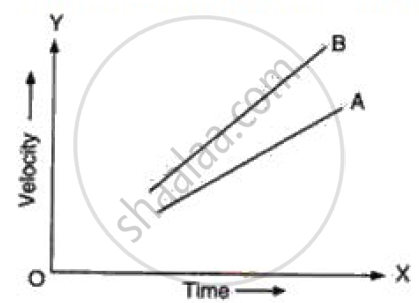
The area under velocity – time graph represents the ______
