Advertisements
Advertisements
प्रश्न
Figure shows the distance-time graph of three students A, B and C. On the basis of the graph, answer the following :
When B meets A, where is C?
Advertisements
उत्तर

C is at 8 km when B meets A.
APPEARS IN
संबंधित प्रश्न
Name the two quantities, the slope of whose graph give acceleration.
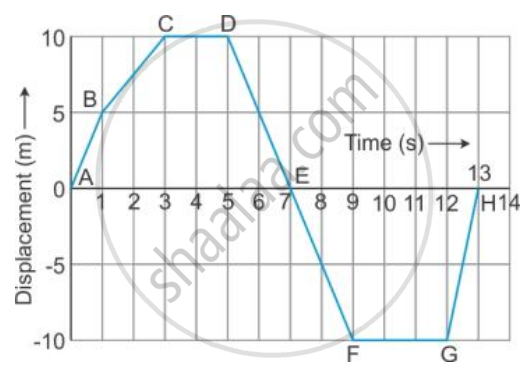
From the displacement-time graph of a cyclist given below in the Figure, find The time after which he reaches the starting point .
Multiple choice Question. Select the correct option.
The slope of displacement – time graph represents.
Multiple choice Question. Select the correct option.
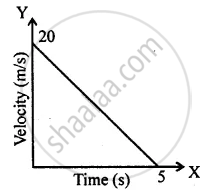
The distance covered in the adjoining velocity-time graph is :
Draw velocity – time graph for the following situation:
When a body, is moving with uniform velocity.
The area under a speed-time graph in a given intervals gives the total distance covered by a body irrespective of its motion being uniform or non-uniform.
Given on th e side are a few speed - time graphs for various objects moving along a stra ight line. Refer below figure. (a), (b), (c) and (d).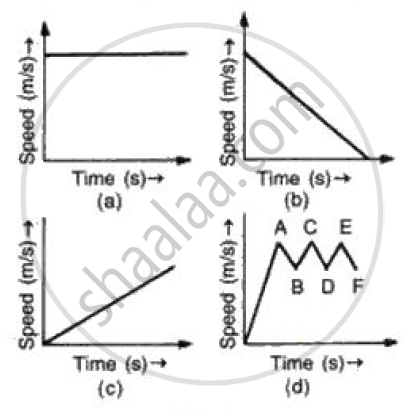
Which of these graphs represent
(a) Uni form motion
(b) Motion with speed increasing
(c) Motion with speed decreasing and
(d) Motion with speed oscillating.?
The slope of the speed–time graph gives ______.
Saphira moves at a constant speed in the same direction. Rephrase the same sentence in fewer words using concepts related to motion.
The given graph shows the variation of velocity (v) with position (x) for a particle moving along a straight line
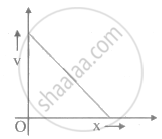
Which of the following graph shows the variation of acceleration (a) with position (x)?
