Advertisements
Advertisements
प्रश्न
Figure shows the distance-time graph of three students A, B and C. On the basis of the graph, answer the following :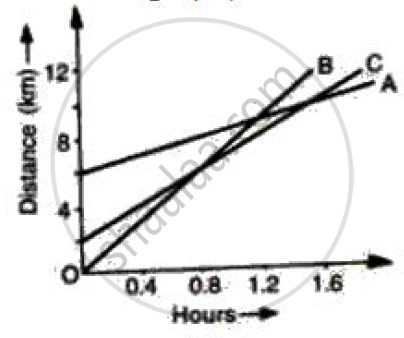
Will the three ever meet at any point on the road?
Advertisements
उत्तर
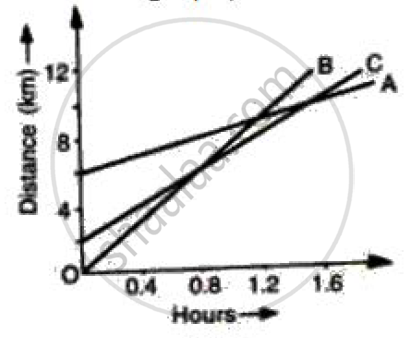
All of them never come at the same point at the same time.
APPEARS IN
संबंधित प्रश्न
The velocity-time graph for part of a train journey is a horizontal straight line. What does this tell you about its acceleration ?
Draw displacement – time graph for the following situation:
When a body is stationary.
Draw velocity – time graph for the following situation:
When a body is moving with variable velocity, but uniform acceleration.
A ball is thrown up vertically and returns back to thrower in 6 s. Assuming there is no air friction, plot a graph between velocity and time. From the graph calculate
- deceleration
- acceleration
- total distance covered by ball
- average velocity.
Draw the following graph:
Speed versus time for a non-uniform acceleration.
Interpret the following graph: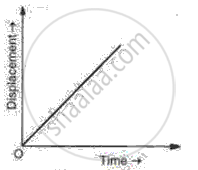
Its time-displacement graph is a straight line.
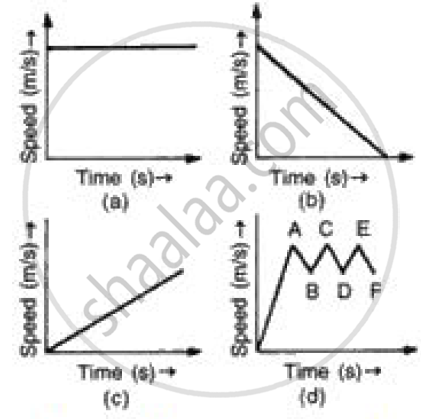
(i) In speed time graph uniform motion is given by a straight line parallel to x axis so figure (a) denotes the uniform motion.
(ii) In speed time graph motion with increasing speed is shown by straight line with positive slope so figure (c) denotes the motion with speed increasing.
(iii) In speed time graph motion with decreasing speed is shown by straight line with negative slope so figure (b) denotes the motion with speed decreasing.
(iv) In speed time graph motion with oscillating speed is shown by zigzag line so figure {d) denotes the motion with speed oscillating.
The area under the v-t graph represents a physical quantity that has the unit.
The given graph shows the variation of velocity (v) with position (x) for a particle moving along a straight line
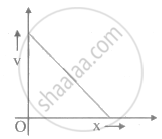
Which of the following graph shows the variation of acceleration (a) with position (x)?
