Advertisements
Advertisements
प्रश्न
Figure shows the distance-time graph of three students A, B and C. On the basis of the graph, answer the following :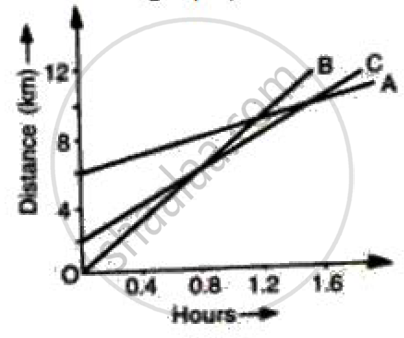
Will the three ever meet at any point on the road?
Advertisements
उत्तर
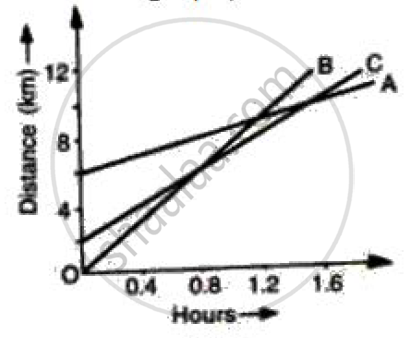
All of them never come at the same point at the same time.
APPEARS IN
संबंधित प्रश्न
The speed-time graph of an ascending passenger lift is given alongside. What is the acceleration of the lift:
(1) during the first two seconds ?
(2) between second and tenth second ?
(3) during the last two seconds ?
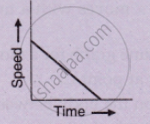
What type of motion is represented by the following graph ?
Multiple choice Question. Select the correct option.
The slope of displacement – time graph represents.
Diagram shows a velocity – time graph for a car starting from rest. The graph has three sections AB, BC, and CD.
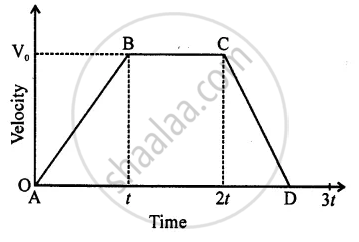
Is the magnitude of acceleration higher or lower than that of retardation? Give a reason.
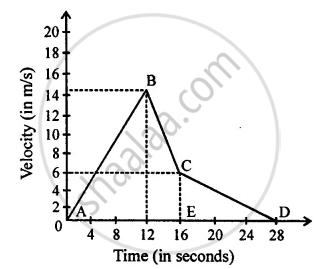
From the velocity – time graph given below, calculate Average velocity in region CED.
The area under a speed-time graph in a given intervals gives the total distance covered by a body irrespective of its motion being uniform or non-uniform.
Name the physical quantity which is equal to the area under speed-time graph.
Draw the following graph:
Distance versus time for a body at rest.
Draw velocity-time graph to show:
Acceleration
Write a sentence to explain the shape of graph.
The area under the v-t graph represents a physical quantity that has the unit.
