Advertisements
Advertisements
Question
Figure shows displacement- time graph of two objects A and B moving in a stra ight line. Which object is moving fa ster?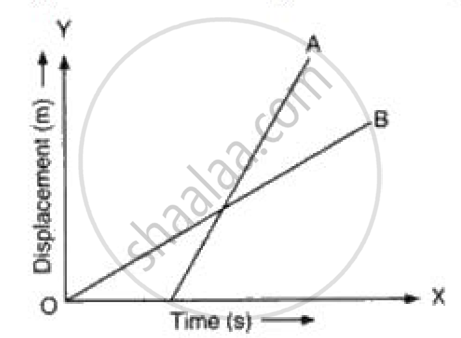
Advertisements
Solution

As slope of line A is greater than line 8 that means velocity of body A is greater than body 8 or in other words body A is moving faster
APPEARS IN
RELATED QUESTIONS
What can you say about the motion of a body if:
its velocity-time graph is a straight line ?
Multiple choice Question. Select the correct option.
A graph is a straight line parallel to the time axis in a distance-time graph. From the graph, it implies:
Diagram shows a velocity – time graph for a car starting from rest. The graph has three sections AB, BC and CD.

Compare the distance travelled in section BC with the distance travelled in section AB.
Represent the position of a body described as at 15 m, 30o north of west, on a graph paper.
Given on th e side are a few speed - time graphs for various objects moving along a stra ight line. Refer below figure. (a), (b), (c) and (d).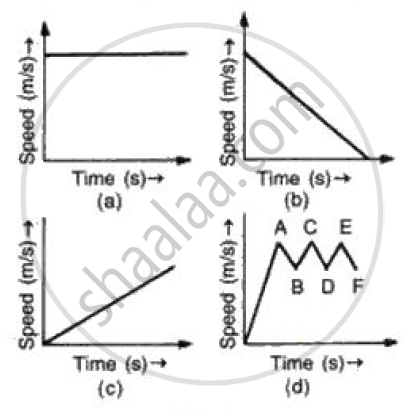
Which of these graphs represent
(a) Uni form motion
(b) Motion with speed increasing
(c) Motion with speed decreasing and
(d) Motion with speed oscillating.?
What can you conclude if the speed-time graph of a body is a straight line sloping upwards and not passing through the origin?
Draw distance-time graph to show:
Increasing velocity
Draw distance-time graph to show:
Uniform velocity
Interpret the following graph: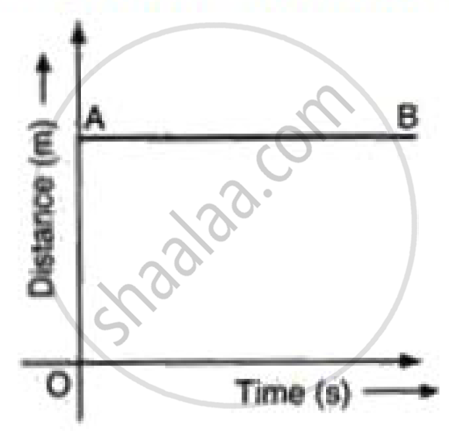
The given graph shows the variation of velocity (v) with position (x) for a particle moving along a straight line
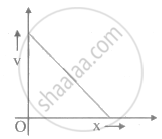
Which of the following graph shows the variation of acceleration (a) with position (x)?
