Advertisements
Advertisements
प्रश्न
Draw the following graph:
Speed versus time for a fluctuating speed.
Advertisements
उत्तर
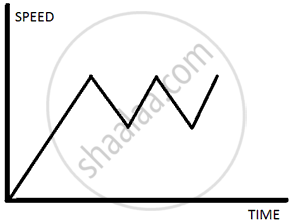
Speed time graph for a body showing fluctuating speed.
APPEARS IN
संबंधित प्रश्न
Draw a velocity-time graph to show the following motion :
A car accelerates uniformly from rest for 5 s ; then it travels at a steady’ velocity for 5 s.
The velocity-time graph for part of a train journey is a horizontal straight line. What does this tell you about its acceleration ?
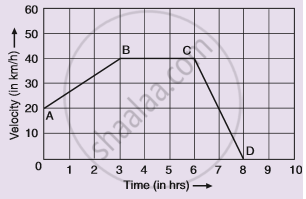
Given alongside is the velocity-time graph for a moving body :
Find :
(i) Velocity of the body at point C.
(ii) Acceleration acting on the body between A and B.
(iii) Acceleration acting on the body between B and C.
The speed-time graph of an ascending passenger lift is given alongside. What is the acceleration of the lift:
(1) during the first two seconds ?
(2) between second and tenth second ?
(3) during the last two seconds ?
What does the slope of velocity-time graph represent?
A ball is thrown up vertically and returns back to thrower in 6 s. Assuming there is no air friction, plot a graph between velocity and time. From the graph calculate
- deceleration
- acceleration
- total distance covered by ball
- average velocity.
What can you conclude if the speed-time graph of a body is a straight line sloping upwards and not passing through the origin?
Figure shows the distance-time graph of three students A, B and C. On the basis of the graph, answer the following :
Will the three ever meet at any point on the road?
State whether true or false. If false, correct the statement.
If the velocity – time graph of a particle is a straight line inclined to X-axis then its displacement – time graph will be a straight line.
Which of the following can determine the acceleration of a moving object.
