Topics
Reproduction in Lower and Higher Plants
- Reproduction
- Asexual Reproduction
- Asexual Reproduction in Unicellular Organisms > Binary Fission
- Binary Fission > Simple Binary Fission
- Binary Fission > Transverse Binary Fission
- Binary Fission > Longitudinal Binary Fission
- Asexual Reproduction in Unicellular Organisms > Multiple Fission
- Asexual Reproduction in Unicellular Organisms > Budding
- Asexual Reproduction in Multicellular Organisms > Fragmentation
- Asexual Reproduction in Multicellular Organisms > Spore Formation
- Vegetative Reproduction or Vegetative Propagation
- Natural Vegetative Propagation
- Artificial Vegetative Propagation
- Sexual Reproduction
- Flower
- Structure and Development of Anther
- Microsporogenesis
- Structure and Development of Male Gametophyte
- Structure and Development of Ovule
- Types of Ovules (Based on Orientation)
- Types of Ovules (Based on Integuments)
- Megasporogenesis
- Development of Female Gametophyte or Embryo Sac
- Pollination
- Autogamy
- Cross-pollination
- Geitonogamy
- Agents and Types of Cross-pollination
- Anemophily
- Hydrophily
- Entomophily
- Ornithophily
- Cheiropteriphily
- Malacophily
- Outbreeding Devices
- Fertilization in Humans
- Pollen Pistil Interaction
- Artificial Hybridization or Artificial Fertilization
- Double Fertilization and Triple Fusion
- Endosperm
- Dicotyledonous Embryo
- Monocotyledonous Embryo
- Seed and Fruit Development
- Dormancy
- Apomixis
- Parthenocarpy
- Polyembryony
- Overview of Reproduction in Lower and Higher Plants
Reproduction in Lower and Higher Animals
- Reproduction
- Asexual Reproduction
- Asexual Reproduction in Animals > Gemmule Formation
- Asexual Reproduction in Multicellular Organisms > Budding
- Asexual Reproduction in Multicellular Organisms > Regeneration
- Sexual Reproduction
- Human Reproduction
- The Male Reproductive System
- Basic Concept of Testes
- Duct system of Male Reproductive Tract
- Accessory Glands of Male Reproductive System
- Semen (Seminal fluid)
- External Genitalia: Penis
- The Female Reproductive System
- Female Internal Reproductive Organ > Ovary
- Female Reproductive Duct System
- External Genitalia: Vulva
- Mammary Glands
- Puberty
- Menstrual Cycle (Ovarian Cycle)
- Major Events of Menstrual Cycle
- Menstrual Hygiene
- Gametogenesis
- Spermatogenesis
- Structure of Sperm
- Oogenesis
- Structure of Secondary Oocyte
- Fertilization in Humans
- Embryonic Development in Human
- Fate of Germ Layers in Embryonic Development
- Stem Cells
- Pregnancy in Humans
- Placenta (Growth) in Human
- Parturition (Birth) in Human
- Lactation in Human
- Concept of Reproductive Health
- Birth Control
- Natural Contraceptive Methods
- Artificial Contraceptive Methods
- Amniocentesis
- Sexually Transmitted Diseases (STD) or Sexually Transmitted Infections (STI)
- Infertility
- Assisted Reproductive Technology (ART)
- Overview of Reproduction in Lower and Higher Animals
Inheritance and Variation
- Heredity
- Gregor Johann Mendel – Father of Genetics
- Mendel's Experiments on Inheritance
- Reasons for Mendel's Success
- Genetic Terminology
- Monohybrid Cross
- Dihybrid Cross
- Mendel's Laws > The Law of Dominance
- Mendel's Laws > The Law of Segregation (Law of Purity of Gametes)
- Mendel's Laws > The Law of Independent Assortment
- Back Cross and Test Cross
- Deviations from Mendel’s Findings
- Exceptions to Mendel's Principles > Incomplete Dominance
- Exceptions to Mendel's Principles > Co-Dominance
- Exceptions to Mendel's Principles > Multiple alleles
- Exceptions to Mendel's Principles > Pleiotropy
- Chromosomal Theory of Inheritance
- Chromosomes - The Carriers of Heredity
- Types of Chromosomes
- Linkage and Crossing Over
- Autosomal Inheritance
- Sex Linked Inheritance
- Colour blindness
- Haemophilia
- Sex Determination
- Sex Determination in Humans
- Sex Determination in Birds
- Sex Determination in Honey Bees
- Human Genetic Disorders
- Thalassemia
- Autosomal Abnormilities
- Sex Chromosome Abnormalities
- Sex Chromosome Abnormalities
- Overview of Inheritance and Variation
Molecular Basis of Inheritance
- Deoxyribonucleic Acid (DNA)
- Griffith’s Experiment
- Avery, McCarty and MacLeod’s Experiment
- The Hershey-Chase Experiment
- Packaging of DNA Helix
- DNA Replication
- Meselson and Stahl’s Experiment
- Mechanism of DNA Replication
- Semi-Conservative Replication
- Protein Synthesis
- Transcription
- Transcription Unit and the Gene
- Genetic Code
- Characteristics of the Genetic Code
- Mutations and Genetic Code
- Transfer RNA (tRNA)
- Translation
- Mechanism of Translation
- Regulation of Gene Expression
- Operon Concept
- The Lac Operon
- Genomics
- Human Genome Project
- DNA Fingerprinting
- Overview of Molecular Basis of Inheritance
Origin and Evolution of Life
- Origin of Life on Earth
- Redi's and Louis Pasteur’s Experiment
- Chemical Evolution of Life
- Urey and Miller’s Experiment
- The RNA World
- Organic Evolution
- Darwin’s Theory of Natural Selection (Darwinism)
- Basic Postulates of Darwinism
- Drawbacks and Criticism of Darwinism
- Mutation Theory
- Modern Synthetic Theory of Evolution
- Modern Synthetic Theory of Evolution > Genetic Variations
- Modern Synthetic Theory of Evolution > Natural Selection
- Modern Synthetic Theory of Evolution > Isolation
- Mechanism of Organic Evolution
- Hardy Weinberg’s Principle
- Adaptive Radiation
- Evidences of Organic Evolution
- Evidences of organic evolution > Palaeontology
- Evidences of Evolution > Connecting Links
- Homology and Homologous Organs
- Analogy and Analogous Organs
- Evidences of Evolution > Vestigial Organs
- Molecular (Genetic) Evidences
- Speciation
- Geological Time Scale
- Human Evolution
- Stages of Human Evolution
- Overview of Origin and Evolution of Life
Plant Water Relation
- Properties of Water
- Water Absorbing Organ
- Water Available to Roots for Absorption
- Diffusion
- Osmosis
- Imbibition
- Osmotic Pressure
- Water Potential (ψ)
- Turgidity and Flaccidity (Plasmolysis)
- Path of Water Across the Root
- Mechanism of Absorption of Water
- Translocation of Water
- Root Pressure Theory (Vital Theory)
- Capillarity Theory (physical force theory)
- Cohesion-Tension Theory (Transpiration pull theory)
- Transport of Mineral Ions
- Transportation of Food and Other Substances
- Concept of Transpiration
- Types of Transpiration > Cuticular Transpiration
- Types of Transpiration > Lenticular Transpiration
- Types of Transpiration > Stomatal Transpiration
- Structure of Stomatal Apparatus
- Significance of Transpiration
- Overview of Plant Water Relation
Plant Growth and Mineral Nutrition
- Plant Growth
- Phases of Plant Growth
- Conditions for Plant Growth
- Plant Growth Rate
- Types of Plant Growth
- Plant Growth Curve
- Differentiation, De-differentiation, Re- Differentiation
- Plant Development
- Plant Plasticity
- Plant Hormones
- Auxins
- Gibberellins
- Cytokinins
- Ethylene
- Abscisic Acid (ABA)
- Photoperiodism
- Vernalization (Yarovization)
- Plant Mineral Nutrition
- Roles of Mineral Elements in Plants
- Minerals Salt Absorption
- Nitrogen Cycle
- Overview of Plant Growth and Mineral Nutrition
Respiration and Circulation
- Respiration
- Gaseous Exchange in plants
- Respiration in Animals
- Human Respiratory System
- Mechanism of Respiration > Breathing
- Mechanism of Respiration > External Respiration
- Mechanism of Respiration > Internal Respiration
- Cellular Respiration
- Regulation of Breathing / Respiration
- Disorders of Respiratory System
- Transportation in Living Organisms
- Circulation in Animals
- Circulatory System Or Blood Vascular System
- Composition of Blood > Cellular Elements: Red Blood Cells (Erythrocytes)
- Composition of Blood > Cellular Elements: White Blood Cells (Leukocytes)
- Composition of Blood > Cellular Elements: Blood Platelets (Thrombocytes)
- Human Heart
- Working Mechanism of Human Heart
- Blood Vessels
- Blood Pressure (B.P.)
- Electrocardiogram (ECG)
- Lymph and Lymphatic System
- Overview of Respiration and Circulation
Control and Co-ordination
- Need for Control and Coordination in Organisms
- Nervous System in Hydra
- Nervous System in Planaria (Flatworm)
- Neural Tissue
- Synapse
- Transmission and Generation of Nerve Impulse
- Central Nervous System (CNS)
- The Human Brain
- The Spinal Cord
- Peripheral Nervous System (PNS)
- Reflex Action
- Autonomic Nervous System (ANS)
- Sensory Receptors
- Human Eye
- Structure of the Eyeball
- Human Ear
- Internal Ear and the Mechanism of Balance
- Disorders of Nervous System
- Human Endocrine System
- Concept of Hormone
- General Properties of Hormones
- Mechanism of Hormone Action
- The Hypothalamus
- Pituitary Gland or Hypophysis Gland
- The Pineal Gland
- Thyroid Gland
- Parathyroid Gland
- Thymus Gland
- Adrenal Gland (Suprarenal Gland)
- Pancreas (Islets of Langerhans)
- Reproductive Glands (Gonads)
- Diffuse Endocrine Glands
- Overview of Control and Co-ordination
Human Health and Diseases
- Health
- The Immune System
- Immunity
- Types of Immunity > Innate Immunity
- Types of Immunity > Acquired Immunity
- Cells of Immune System
- Vaccination and Immunization
- Structure of Antibody
- Formation of Antigen-Antibody Complex
- Blood Transfusion and Blood Groups (ABO and Rh system)
- Disease
- Diseases Caused by Protozoa > Malaria
- Diseases Caused by Protozoa > Amoebiasis (Amoeboic dysentery)
- Diseases Caused by Helminths > Ascariasis
- Diseases Caused by Helminths > Filariasis (Elephantiasis)
- Diseases Caused by Bacteria > Typhoid
- Diseases Caused by Bacteria > Pneumonia
- Diseases Caused by Viruses > Common Cold
- Diseases Caused by Fungi > Ringworm
- Diseases Caused by Viruses > Dengue Fever
- Types of Cancer
- Causes of Cancer
- Organs Commonly Affected by Cancer
- Prevention/Treatment of Cancer
- Acquired Immuno Deficiency Syndrome (AIDS)
- Concept of Adolescence
- Addiction
- Drug Abuse
- Addiction and Dependence
- Effects of Drug and Alcohol Abuse
- Prevention and Control of Drugs and Alcohol Abuse
- Cancer
Enhancement of Food Production
- Improvement in Food Production
- Plant Breeding
- Hybridization and its Technique
- Mutation Breeding
- Tissue Culture
- Single Cell Protein (SCP)
- Biofortification
- Animal Husbandry (Livestock)
- Animal Husbandry (Livestock) > Animal Breeding
- Animal Husbandry (Livestock) > Dairy (Livestock) Farm Management
- Animal Husbandry (Livestock) > Poultry Farm Management
- Animal Husbandry (Livestock) > Apiculture (Bee Farming)
- Animal Husbandry (Livestock) > Pisciculture (Fish Farming)
- Animal Husbandry (Livestock) > Sericulture
- Animal Husbandry (Livestock) > Lac Culture
- Microbes in Human Welfare
- Microbes in Industrial Products
- Microbes in Sewage Treatment
- Microbes in Energy Generation
- Microbes as Biocontrol Agents
- Microbes as Biofertilizers
- Microbial Role in Dairy Products
- Overview of Enhancement of Food Production
Human Reproduction
Biotechnology
- Concept of Biotechnology
- Principles of Processes of Biotechnology
- Technique of Gene Cloning and rDNA Technology
- Methodology for rDNA Technology
- Applications of Biotechnology in Health and Medicine
- Applications of Biotechnology in Agriculture
- Gene Therapy
- Crop Biotechnology > Genetically Modified Organisms (GMOs)
- Transgenic Plants
- Transgenic Animals
- Bioethics
- Effects of Biotechnology on the Environment
- Effects of Biotechnology on Human Health
- Biopatent
- Biopiracy
- Overview of Biotechnology
Organisms and Populations
- Organisms and Their Environment
- Habitat
- Niche
- Habitat Vs Niche
- Climatic Factors > Temperature
- Climatic Factors > Precipitation
- Climatic Factors > Light
- Soil Factors (Edaphic Factors)
- Adaptations
- Population and Population Attributes
- Population Age Distribution
- Population Growth
- Population Interactions
- Positive Interactions > Mutualism (Symbiosis)
- Negative Interactions > Competition
- Negative Interactions > Parasitism
- Negative Interactions > Predation
- Positive Interactions > Commensalism
- Overview of Organisms and Populations
Ecosystems and Energy Flow
Biodiversity, Conservation and Environmental Issues
- Biodiversity
- Levels of Biodiversity
- Patterns of Biodiversity
- Importance of Species Diversity to the Ecosystem
- Biodiversity Current Scenario
- Loss of Biodiversity
- Threatened Species
- Conservation of Biodiversity
- Biodiversity Conservation Methods
- Biological Diversity Act, 2002
- Environmental Issues
- Air Pollution
- Effects of Air Pollution
- Major Air Pollutants
- Prevention and Control of Air Pollution
- Noise Pollution
- Water Pollution
- Sources of Water Pollution
- Prevention and Control of Water Pollution
- Solid Waste Management
- Greenhouse Effect
- Global Warming
- Ozone Layer Depletion
- Deforestation and Its Causes
- Mission Harit Maharashtra
- Overview of Biodiversity, Conservation and Environmental Issues
Definition: Age Distribution
The proportion of individuals belonging to different age groups in a population is called age distribution.
Definition: Age Structure
The arrangement or composition of a population based on different age groups is called age structure.
Definition: Age Pyramid
The graphical representation showing the proportion of individuals in different age groups of a population is called an age pyramid.
Age Attributes & Age Pyramids
An individual has a specific age, but a population has an age distribution (the percentage of individuals in different age groups). When this data is plotted geometrically, it forms an age pyramid.
For ecological analysis, a population is divided into three functional age groups:
- Pre-reproductive (age 0 - 14 years)
- Reproductive (age 15 - 44 years)
- Post-reproductive (age 45 - 85+ years)
Standard Types of Age Pyramids
| Feature / Type of Pyramid | Expanding | Stable | Declining |
| Geometric Shape | Broad base (triangular) | Bell-shaped polygon | Urn-shaped figure |
| Key Characteristic | Very high percentage of pre-reproductive individuals. | Pre-reproductive and reproductive age groups are nearly equal in size. | Narrow base due to a very low percentage of pre-reproductive individuals. |
| Population Growth Status | Rapid Growth: The birth rate is high; the next generation is larger than the previous. | Zero/Slow Growth: Growth rate stabilises; post-reproductive remains the smallest. | Negative Growth: Birth rate drastically reduces; population is shrinking/dying off. |
| Examples | Yeast, housefly, Kenya, Nigeria | USA, Australia, Denmark | Germany, Hungary |
Representation of Age Pyramids for Human Population
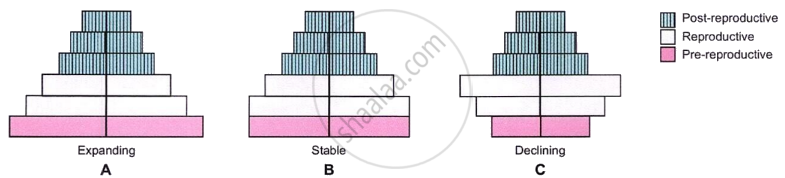
A-C. Representation of age pyramids for human population: A. expanding; B. stable; C. declining
Population Density (N) & Measurement Metrics
While absolute headcount is standard, counting total numbers can be misleading or impossible in nature. Alternative ecological metrics include:
- Biomass / Percent Cover: Used when individual headcounts give a distorted picture of ecological impact.
Example: A few large predatory animals vs. millions of termites, or a single massive banyan tree vs. hundreds of small grass blades. - Relative Density: Used for comparative ecological investigations without finding the absolute number.
Example: The number of fish or insects caught per trap. - Indirect Estimation: Used for elusive, nocturnal, or dangerous animals.
Example: Estimating wildlife populations during a tiger census using pug marks (footprints) and faecal pellets.
Key Points: Population Age Distribution
- Age distribution refers to the percentage of individuals in different age groups in a population.
- An age pyramid is a graphical representation of age distribution showing three groups: pre-reproductive (0–14 years), reproductive (15–44 years), and post-reproductive (45+ years).
- Population size or density (N) indicates the number of individuals in a population, but it is not always measured only by counting numbers.
- In some cases, biomass (total mass of living organisms) is a more meaningful measure than number, especially when organism sizes vary.
- Direct counting of population may be difficult or time-consuming, especially for very large or microscopic populations.
- Relative and indirect methods like trap counts, pug marks, or faecal pellets are used to estimate population size when exact counting is not possible.
