Topics
Commercial Mathematics
Compound Interest
- Compound Interest as a Repeated Simple Interest Computation with a Growing Principal
- Use of Compound Interest in Computing Amount Over a Period of 2 Or 3-years
- Use of Formula
- Finding CI from the Relation CI = A – P
Goods and Services Tax (G.S.T.)
Algebra
Banking
Geometry
Shares and Dividends
Linear Inequations
Mensuration
Quadratic Equations
- Concept of Quadratic Equations
- Method of Solving a Quadratic Equation>Factorisation Method
- Method of Solving a Quadratic Equation>Factorisation Method
- Method of Solving a Quadratic Equation>Quadratic Formula (Shreedharacharya's Rule)
- Nature of Roots of a Quadratic Equation
- Equations Reducible to Quadratic Equations
Trigonometry
Ratio and Proportion
Statistics
Factorisation of Polynomials
- Function and Polynomial
- Division Algorithm for Polynomials
- Remainder Theorem
- Factor Theorem
- Applications of Factor Theorem
Probability
Matrices
Arithmetic and Geometric Progression
Co-ordinate Geometry
- Foundation of Coordinate Geometry
- Advanced Concept of Reflection in Mathematics
- Invariant Points
- Combination of Reflections
- Using Graph Paper for Reflection
Similarity
Symmetry
Loci
- Locus
- Points Equidistant from Two Given Points
- Points Equidistant from Two Intersecting Lines
- Summary of Important Results on Locus
- Important Points on Concurrency in a Triangle
Circles
Tangent and Secant Properties
Constructions
Area and Volume of Solids (Cylinder, Cone and Sphere)
- Mensuration of Cylinder
- Hollow Cylinder
- Mensuration of Cones
- Mensuration of a Sphere
- Hemisphere
- Conversion of Solids
- Solid Figures
- Problems on Mensuration
Trigonometrical Identities
Heights and Distances
- Angles of Elevation and Depression
- Problems based on Elevation and Depression
Statistics : basic concepts, Mean, Median, Mode. Histograms and Ogive
Probability
Introduction
Statistics is the branch of mathematics that deals with collecting, organising, analysing, interpreting, and presenting data.
In real life, data are everywhere:
-
A school analyses students’ marks to understand performance.
-
A company studies monthly sales to plan production.
-
A doctor records patients’ body temperatures to identify a typical value.
-
A government uses census data to plan schools, hospitals, and transport.
Often, a large data set cannot be understood by looking at every value. We therefore use a single representative value called a measure of central tendency.
Formula: Mean
\[ \begin{array}{c} \text{The mean of statistical data} = \dfrac{\text{The sum of all scores}}{\text{Total no. of scores}} = \dfrac{\sum\limits_{i = 1}^{N} x_{i}}{N} \end{array} \]
(Here \[ x_{i} \] is the \[ i^{th} \] score)
Mean is denoted by \[ \overline{X} \] and it represents the average of the given data.
\[ \overline{X} = \frac{\sum\limits_{i = 1}^{N} x_{i}}{N} \]
Reading the Σ Notation
\[ \begin{array}{|l|l|} \hline \textbf{SYMBOL} & \textbf{MEANING} \\ \hline \Sigma \text{ (sigma)} & \text{“Add up”: the sum of all the terms that follow.} \\ \hline x_{i} & \text{The } i^{th} \text{ score: } x_{1} \text{ is the first score, } x_{2} \text{ the second, and so on.} \\ \hline i = 1 \text{ (below } \Sigma) & \text{Start adding from the first score.} \\ \hline N \text{ (above } \Sigma) & \text{Stop at the last score; } N \text{ is the total number of scores.} \\ \hline \overline{X} \text{ (X-bar)} & \text{The mean (average) of the data.} \\ \hline \end{array} \]
Expanded:
\[ \sum\limits_{i = 1}^{N} x_{i} = x_{1} + x_{2} + x_{3} + \ldots + x_{N} \]
Mean, Median and Mode
Real-Life Examples
Imagine three friends want to describe the “typical” pocket money in a group.
-
One friend calculates the mean by adding everyone’s pocket money and dividing by the number of students.
-
Another finds the median by arranging the amounts and choosing the middle value.
-
A third finds the mode by identifying the pocket-money amount that most students receive.
All three are correct, but they describe the data in different ways.
Key points: Concepts of Statistics
-
Statistics deals with collecting, organising, analysing, and interpreting data.
-
Central tendency gives a single representative value for a data set.
-
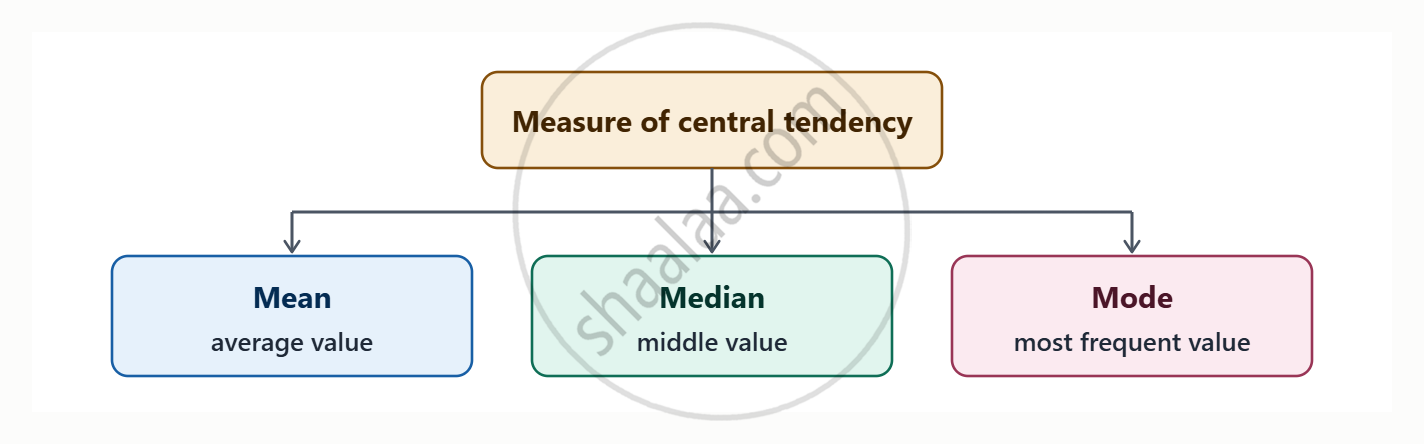
Mean is the arithmetic average.
-
Median is the middle value of ordered data.
-
Mode is the most frequently occurring value.
Test Yourself
Shaalaa.com | Concepts of Statistics
Related QuestionsVIEW ALL [51]
Find the mean, median and mode of the following data:
| Marks obtained | 25 – 35 | 35 – 45 | 45 – 55 | 55 – 65 | 65 – 75 | 75 – 85 |
| No. of students | 7 | 31 | 33 | 17 | 11 | 1 |
The following table gives the daily income of 50 workers of a factory:
| Daily income (in Rs) | 100 – 120 | 120 – 140 | 140 – 160 | 160 – 180 | 180 – 200 |
| No. of workers | 12 | 14 | 8 | 6 | 10 |
Find the mean, median and mode of the above data.
The daily income of a sample of 50 employees are tabulated as follows:
| Income (in Rs.): | 1-1200 | 201 -400 | 401-600 | 601 - 800 |
| No.of employees : | 14 | 15 | 14 | 7 |
Find the mean daily income of employees.
The table below shows the daily expenditure on food of 30 households in a locality:
| Daily expenditure (in Rs) | Number of households |
| 100 – 150 | 6 |
| 150 – 200 | 7 |
| 200 – 250 | 12 |
| 250 – 300 | 3 |
| 300 – 350 | 2 |
Find the mean and median daily expenditure on food.
