Advertisements
Advertisements
Question
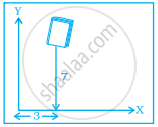
In the given figure the position of the book on the table may be given by ______.
Options
(7, 3)
(3, 7)
(3, 3)
(7, 7)
Advertisements
Solution
In the given figure the position of the book on the table may be given by (3, 7).
Explanation:
The book is at a distance of 3 units from Y-axis and 7 units from X-axis.
Hence, the position of the book on the table is given by (3, 7).
APPEARS IN
RELATED QUESTIONS
Match the coordinates given in Column A with the items mentioned in Column B.
| Column A | Column B |
| (1) (0, 5) | (a) y coordinate is 2 × x - coordinate + 1. |
| (2) (2, 3) | (b) Coordinates of origin. |
| (3) (4, 8) | (c) Only y–coordinate is zero. |
| (4) (3, 7) | (d) The distance from x-axis is 5. |
| (5) (0, 0) | (e) y coordinate is double of x-coordinate. |
| (6) (5, 0) | (f) The distance from y-axis is 2. |
Match the ordinates of the points given in Column A with the items mentioned in Column B.
| Column A | Column B |
| (a) (7, 0) | (i) The ordinate is double the abscissa. |
| (b) (11, 11) | (ii) The ordinate is zero. |
| (c) (4, 8) | (iii) The ordinate is equal to the abscissa. |
| (d) (6, 2) | (iv) The abscissa is double the ordinate. |
| (e) (0, 9) | (v) The abscissa is triple the ordinate. |
| (f) (6, 3) | (vi) The abscissa is zero. |
From the given graph, choose the letters that indicate the location of the points given below.

- (2, 0)
- (0, 4)
- (5, 1)
- (2, 6)
- (3, 3)
Write the x-coordinate (abscissa) of the given point.
(7, 3)
Make a line graph for the area of a square as per the given table.
| Side (in cm) | 1 | 2 | 3 | 4 |
| Area (in cm2) | 1 | 4 | 9 | 16 |
Is it a linear graph?
The graph given below compares the sales of ice creams of two vendors for a week.
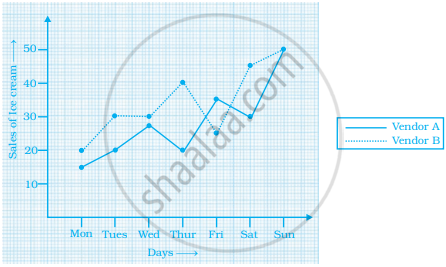
Observe the graph and answer the following questions.
- Which vendor has sold more icecreams on Friday?
- For which day was the sales same for both the vendors?
- On which day did the sale of vendor A increase the most as compared to the previous day?
- On which day was the difference in sales the maximum?
- On which two days was the sales same for vendor B?
Extend the line segment on both sides to meet the coordinate axes. What are the coordinates of the points where this line meets the x-axis and the y-axis?
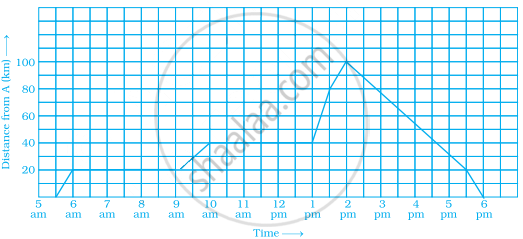
A man started his journey on his car from location A and came back. The given graph shows his position at different times during the whole journey.
- At what time did he start and end his journey?
- What was the total duration of journey?
- Which journey, forward or return, was of longer duration?
- For how many hours did he not move?
- At what time did he have the fastest speed?
This graph shows the per cent of students who dropped out of school after completing High School. The point labelled A shows that, in 1996, about 4.7% of students dropped out.

- In which year was the dropout the rate highest? In which year was it the lowest?
- When did the per cent of students who dropped out of high school first fall below 5%?
- About what per cent of students dropped out of high school in 2007? About what per cent of students stayed in high school in 2008?
Consider this input/output table.
| Input | 1 | 2 | 4 | 5 | 7 |
| Output | 2 | 5 | 11 | 14 | 20 |
- Graph the values from the table by taking Input along horizontal axis from 0 to 8 and Output along vertical axis from 0 to 24.
- Use your graph to predict the outputs for inputs of 3 and 8.
