Advertisements
Advertisements
Question
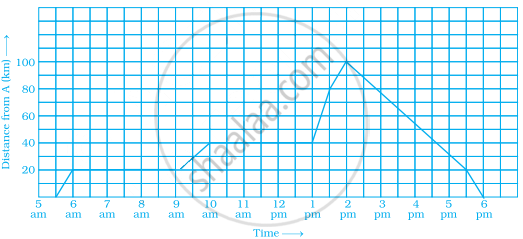
A man started his journey on his car from location A and came back. The given graph shows his position at different times during the whole journey.
- At what time did he start and end his journey?
- What was the total duration of journey?
- Which journey, forward or return, was of longer duration?
- For how many hours did he not move?
- At what time did he have the fastest speed?
Advertisements
Solution
Analysing the graph carefully, we observe that
- He started his journey at 5:30 AM and end at 6 PM.
- Total duration of journey was 12:30 h.
- His forward journey is of duration 8:30 h and return journey is of duration 4 h. Forward journey was of longer duration.
- He did not move from 6:30 AM to 9:30 AM and 10 AM to 1 PM. So, he did not move for 6 h.
- He have the fastest speed at 1 PM.
APPEARS IN
RELATED QUESTIONS
Decide which of the following statement is true and which is false. Give reasons for your answer.
A point whose x-coordinate is zero, will lie on the y-axis.
Decide which of the following statements is true and which is false. Give reasons for your answer.
Points whose x and y coordinates are equal, lie on a line passing through the origin.

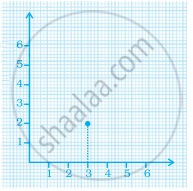
In the given graph the coordinates of point x are ______.
All points with y-coordinate as zero lie on the ______.
In the point (4, 7), 4 denotes the ______.
Write the y-coordinate (ordinate) of the given point.
(2, 7)
Plot the given points on a graph sheet and check if the points lie on a straight line. If not, name the shape they form when joined in the given order.
(1, 2), (2, 4), (3, 6), (4, 8)
Observe the toothpick pattern given below:
(a) Imagine that this pattern continues. Complete the table to show the number of toothpicks in the first six terms.
| Pattern | 1 | 2 | 3 | 4 | 5 | 6 |
| Toothpicks | 4 | 13 |
(b) Make a graph by taking the pattern numbers on the horizontal axis and the number of toothpicks on the vertical axis. Make the horizontal axis from 0 to 10 and the vertical axis from 0 to 30.
(c) Use your graph to predict the number of toothpicks in patterns 7 and 8. Check your answers by actually drawing them.
(d) Would it make sense to join the points on this graph? Explain.
Sonal and Anmol made a sequence of tile designs from square white tiles surrounding one square purple tile. The purple tiles come in many sizes. Three of the designs are shown below.
(a) Copy and complete the table
| Side Length of Purple Titles | 1 | 2 | 3 | 4 | 5 | 10 | 100 |
| Number of white Tiles in Border |
 |
 |
 |
(b) Draw a graph using the first five pairs of numbers in your table.
(c) Do the points lie on a line?
