Advertisements
Advertisements
Question
Decide which of the following statement is true and which is false. Give reasons for your answer.
A point whose x-coordinate is zero, will lie on the y-axis.
Advertisements
Solution
The examples of points having x-coordinate as zero are (0,3), (0,6), (0,9). This can be represented in the following manner:
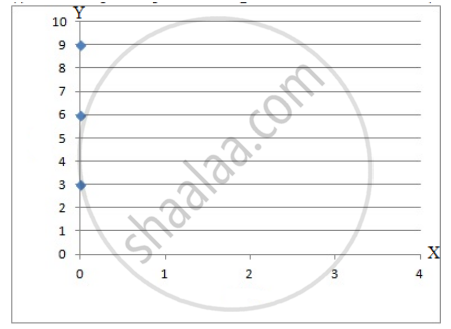
From the figure, it can be seen that these points lie on the y-axis. Hence, the statement is true.
RELATED QUESTIONS
Locate the points:
(2, 1), (2, 2), (2, 3), (2, 4)
Decide which of the following statements is true and which is false. Give reasons for your answer.
The coordinates of the origin are (0, 0).
We need ______ coordinates for representing a point on the graph sheet.
All points with y-coordinate as zero lie on the ______.
In the point (4, 7), 4 denotes the ______.
The ordinate of a point is its distance from the y-axis.
The points (3, 5) and (5, 3) represent the same point.
Locate the points A(1, 2), B(4, 2) and C(1, 4) on a graph sheet taking suitable axes. Write the coordinates of the fourth point D to complete the rectangle ABCD.
Consider this input/output table.
| Input | 1 | 2 | 4 | 5 | 7 |
| Output | 2 | 5 | 11 | 14 | 20 |
- Graph the values from the table by taking Input along horizontal axis from 0 to 8 and Output along vertical axis from 0 to 24.
- Use your graph to predict the outputs for inputs of 3 and 8.
