Advertisements
Advertisements
Question
The ordinate of a point is its distance from the y-axis.
Options
True
False
Advertisements
Solution
This statement is False.
Explanation:
The ordinate of a point is nothing but coordinate of the point and the y-coordinate denotes the distance of a point from x-axis.
APPEARS IN
RELATED QUESTIONS
Write the coordinates of each of the vertices of each polygon in Fig. 27.9.

Decide which of the following statement is true and which is false. Give reasons for your answer.
A point whose x-coordinate is zero, will lie on the y-axis.
In the given graph the letter that indicates the point (0, 3) is ______.

We need ______ coordinates for representing a point on the graph sheet.
In the point (4, 7), 4 denotes the ______.
Write the x-coordinate (abscissa) of the given point.
(0, 5)
Plot the given points on a graph sheet and check if the points lie on a straight line. If not, name the shape they form when joined in the given order.
(4, 2), (2, 4), (3, 3), (5, 4)
If y-coordinate is 3 times x-coordinate, form a table for it and draw a graph.
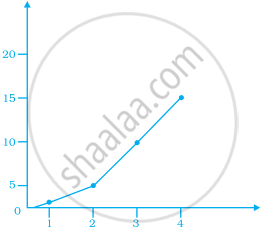
Observe the given graph carefully and complete the table given below.
| x | 1 | 2 | 3 | 4 | 5 |
| y |
Observe the toothpick pattern given below:
(a) Imagine that this pattern continues. Complete the table to show the number of toothpicks in the first six terms.
| Pattern | 1 | 2 | 3 | 4 | 5 | 6 |
| Toothpicks | 4 | 13 |
(b) Make a graph by taking the pattern numbers on the horizontal axis and the number of toothpicks on the vertical axis. Make the horizontal axis from 0 to 10 and the vertical axis from 0 to 30.
(c) Use your graph to predict the number of toothpicks in patterns 7 and 8. Check your answers by actually drawing them.
(d) Would it make sense to join the points on this graph? Explain.
