Advertisements
Advertisements
Question
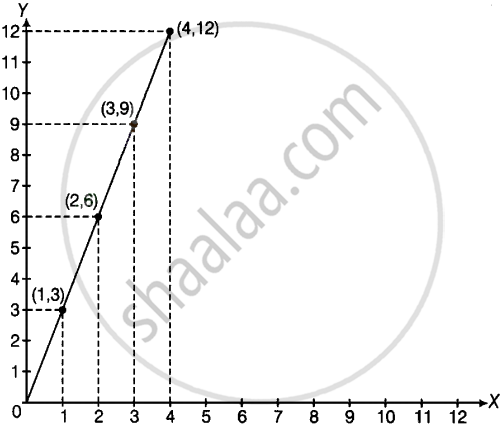
If y-coordinate is 3 times x-coordinate, form a table for it and draw a graph.
Advertisements
Solution
Since, the ordinate is 3 times the abscissa, we get the following values.
| x | 1 | 2 | 3 | 4 |
| y | 3 | 6 | 9 | 12 |
APPEARS IN
RELATED QUESTIONS
Write the coordinates of the vertices of each of these adjoining figures.

Find the coordinates of points P, Q, R and S in Fig. 27.8.

The distance of any point from the y-axis is the ______ coordinate.
All points with y-coordinate as zero lie on the ______.
A point has 5 as its x–coordinate and 4 as its y–coordinate. Then the coordinates of the point are given by ______.
The distance of any point from the x-axis is called the x-coordinate.
From the given graph, choose the letters that indicate the location of the points given below.

- (2, 0)
- (0, 4)
- (5, 1)
- (2, 6)
- (3, 3)
Study the given map of a zoo and answer the following questions.

- Give the location of lions in the zoo.
- (D, f) and (C, d) represent locations of which animals in the zoo?
- Where are the toilets located?
- Give the location of canteen.
Study the graph given below of a person who started from his home and returned at the end of the day. Answer the questions that follow.

- At what time did the person start from his home?
- How much distance did he travel in the first four hours of his journey?
- What was he doing from 3 pm to 5 pm?
- What was the total distance travelled by him throughout the day?
- Calculate the distance covered by him in the first 8 hours of his journey.
- At what time did he cover 16 km of his journey?
- Calculate the average speed of the man from (a) A to B (b) B to C.
- At what time did he return home?
The table given below shows the temperatures recorded on a day at different times.

Observe the table and answer the following questions.
- What is the temperature at 8 am?
- At what time is the temperature 3°C?
- During which hour did the temperature fall?
- What is the change in temperature between 7 am and 10 am?
- During which hour was there a constant temperature?
