Advertisements
Advertisements
Question
Find the coordinates of points P, Q, R and S in Fig. 27.8.

Advertisements
Solution
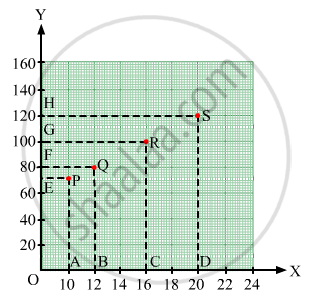
Draw perpendiculars PA, QB, RC and SD from vertices P, Q, R and S on the x-axis. Also ,draw perpendiculars
PE, QF, RG and SH on the y-axis from these points.
PE = 10 units and PA = 70 units
Therefore, the coordinates of vertex P are (10, 70).
QF = 12 units and QB = 80 units
Therefore, the coordinates of vertex Q are (12, 80).
RG = 16 units and RC = 100 units
Therefore, the coordinates of vertex R are (16, 100).
SH = 20 units and SD = 120 units
Therefore, the coordinates of vertex S are (20, 120).
RELATED QUESTIONS
Plot the following points on a graph sheet. Verify if they lie on a line
K(2, 3), L(5, 3), M(5, 5), N(2, 5)
Locate the points:
(1, 4), (2, 4), (3, 4), (4, 4).
Decide which of the following statements is true and which is false. Give reasons for your answer.
A point whose y-coordinate is zero, will lie on x-axis.
All points with y-coordinate as zero lie on the ______.
In the point (4, 7), 4 denotes the ______.
The y-coordinate of any point lying on the x-axis will be zero.
Write the x-coordinate (abscissa) of the given point.
(0, 5)
The graph given below compares the sales of ice creams of two vendors for a week.
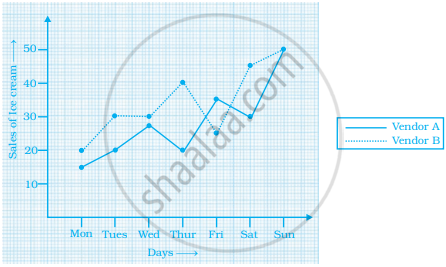
Observe the graph and answer the following questions.
- Which vendor has sold more icecreams on Friday?
- For which day was the sales same for both the vendors?
- On which day did the sale of vendor A increase the most as compared to the previous day?
- On which day was the difference in sales the maximum?
- On which two days was the sales same for vendor B?
The following graph shows the journey made by two cyclists, one from town A to B and the other from town B to A.
- At what time did cyclist II rest? How long did the cyclist rest?
- Was cyclist II cycling faster or slower after the rest?
- At what time did the two cyclists meet?
- How far had cyclist II travelled when he met cyclist I?
- When cyclist II reached town A, how far was cyclist I from town B?

Observe the toothpick pattern given below:
(a) Imagine that this pattern continues. Complete the table to show the number of toothpicks in the first six terms.
| Pattern | 1 | 2 | 3 | 4 | 5 | 6 |
| Toothpicks | 4 | 13 |
(b) Make a graph by taking the pattern numbers on the horizontal axis and the number of toothpicks on the vertical axis. Make the horizontal axis from 0 to 10 and the vertical axis from 0 to 30.
(c) Use your graph to predict the number of toothpicks in patterns 7 and 8. Check your answers by actually drawing them.
(d) Would it make sense to join the points on this graph? Explain.
