Advertisements
Advertisements
प्रश्न
Find the coordinates of points P, Q, R and S in Fig. 27.8.

Advertisements
उत्तर
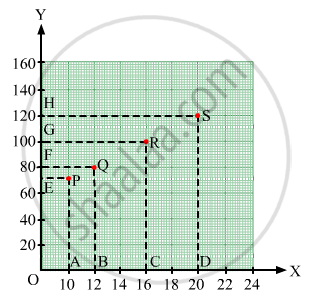
Draw perpendiculars PA, QB, RC and SD from vertices P, Q, R and S on the x-axis. Also ,draw perpendiculars
PE, QF, RG and SH on the y-axis from these points.
PE = 10 units and PA = 70 units
Therefore, the coordinates of vertex P are (10, 70).
QF = 12 units and QB = 80 units
Therefore, the coordinates of vertex Q are (12, 80).
RG = 16 units and RC = 100 units
Therefore, the coordinates of vertex R are (16, 100).
SH = 20 units and SD = 120 units
Therefore, the coordinates of vertex S are (20, 120).
संबंधित प्रश्न
Write the coordinates of the vertices of each of these adjoining figures.

The following table shows the amount of rice grown by a farmer in different years:
| Years: | 2000 | 2001 | 2002 | 2003 | 2004 | 2005 | 2006 |
| Rice grown (in quintals): | 200 | 180 | 240 | 260 | 250 | 200 | 270 |
Plot a graph to illustrate this information.

In the given graph the coordinates of point x are ______.
The point (3, 4) is at a distance of ______.
In the point (2, 3), 3 denotes the y-coordinate.
Plot the given points on a graph sheet and check if the points lie on a straight line. If not, name the shape they form when joined in the given order.
(1, 2), (2, 4), (3, 6), (4, 8)
Explain the situations represented by the following distance-time graph.

Locate the points A(1, 2), B(3, 4) and C(5, 2) on a graph sheet taking suitable axes. Write the coordinates of the fourth point D to complete the rhombus ABCD. Measure the diagonals of this rhombus and find whether they are equal or not.
Ajita starts off from home at 07.00 hours with her father on a scooter that goes at a uniform speed of 30 km/h and drops her at her school after half an hour. She stays in the school till 13.30 hours and takes an auto-rickshaw to return home. The rickshaw has a uniform speed of 10 km/h. Draw the graph for the above situation and also determine the distance of Ajita’s school from her house.
