Advertisements
Advertisements
प्रश्न
Locate the points A(1, 2), B(3, 4) and C(5, 2) on a graph sheet taking suitable axes. Write the coordinates of the fourth point D to complete the rhombus ABCD. Measure the diagonals of this rhombus and find whether they are equal or not.
Advertisements
उत्तर
Given points are A(1, 2), B(3, 4) and C(5, 2).
Location of given points on the graph given below.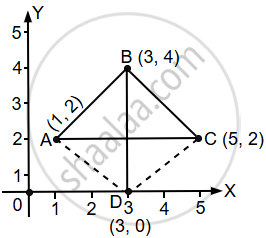
To complete the rhombus the fourth point will be (3, 0).
∴ The Length of the diagonals, AC = BD = 4 units and they are equal.
APPEARS IN
संबंधित प्रश्न
Decide which of the following statements is true and which is false. Give reasons for your answer.
A point whose y-coordinate is zero, will lie on x-axis.
Decide which of the following statements is true and which is false. Give reasons for your answer.
The coordinates of the origin are (0, 0).

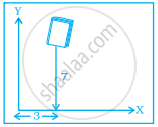
In the given figure the position of the book on the table may be given by ______.
For fixing a point on the graph sheet we need two coordinates.
Write the x-coordinate (abscissa) of the given point.
(5, 7)
Draw a parallelogram ABCD on a graph paper with the coordinates given in Table I. Use this table to complete Tables II and III to get the coordinates of E, F, G, H and J, K, L, M.
| Point | (x, y) |
| A | (1, 1) |
| B | (4. 4) |
| C | (8, 4) |
| D | (5, 1) |
Table I
| Point | (0.5x, 0.5y) |
| E | (0.5, 0.5) |
| F | |
| G | |
| H |
Table II
| Point | (2x, 1.5y) |
| J | (2, 1.5) |
| K | |
| L | |
| M |
Table III
Draw parallelograms EFGH and JKLM on the same graph paper.
Plot the points (2, 4) and (4, 2) on a graph paper, then draw a line segment joining these two points.
Ajita starts off from home at 07.00 hours with her father on a scooter that goes at a uniform speed of 30 km/h and drops her at her school after half an hour. She stays in the school till 13.30 hours and takes an auto-rickshaw to return home. The rickshaw has a uniform speed of 10 km/h. Draw the graph for the above situation and also determine the distance of Ajita’s school from her house.
Draw the line graph using suitable scale to show the annual gross profit of a company for a period of five years.
| Year | 1st | 2nd | 3rd | 4th | 5th |
| Gross Profit (in Rs) |
17,00,000 | 15,50,000 | 11,40,000 | 12,10,000 | 14,90,000 |
This graph shows the per cent of students who dropped out of school after completing High School. The point labelled A shows that, in 1996, about 4.7% of students dropped out.

- In which year was the dropout the rate highest? In which year was it the lowest?
- When did the per cent of students who dropped out of high school first fall below 5%?
- About what per cent of students dropped out of high school in 2007? About what per cent of students stayed in high school in 2008?
