Advertisements
Advertisements
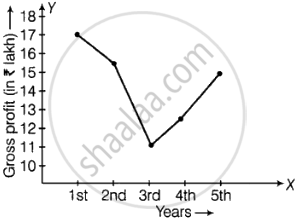
प्रश्न
Draw the line graph using suitable scale to show the annual gross profit of a company for a period of five years.
| Year | 1st | 2nd | 3rd | 4th | 5th |
| Gross Profit (in Rs) |
17,00,000 | 15,50,000 | 11,40,000 | 12,10,000 | 14,90,000 |
Advertisements
उत्तर
We have taken years on X-axis and gross profit on Y-axis.
The line graph of an annual gross profit of a company for a period of five years are given below.
APPEARS IN
संबंधित प्रश्न
Plot the following points on a graph sheet. Verify if they lie on a line
A(4, 0), B(4, 2), C(4, 6), D(4, 2.5)
State whether True or False. Correct those are false.
The coordinates of the origin are (0, 0).
Locate the points:
(1, 1), (1, 2), (1, 3), (1, 4)
Write the coordinates of each of the vertices of each polygon in Fig. 27.9.

Write the x-coordinate (abscissa) of the given point.
(5, 7)
Locate the points A(1, 2), B(3, 4) and C(5, 2) on a graph sheet taking suitable axes. Write the coordinates of the fourth point D to complete the rhombus ABCD. Measure the diagonals of this rhombus and find whether they are equal or not.
The table given below shows the temperatures recorded on a day at different times.

Observe the table and answer the following questions.
- What is the temperature at 8 am?
- At what time is the temperature 3°C?
- During which hour did the temperature fall?
- What is the change in temperature between 7 am and 10 am?
- During which hour was there a constant temperature?
Draw a parallelogram ABCD on a graph paper with the coordinates given in Table I. Use this table to complete Tables II and III to get the coordinates of E, F, G, H and J, K, L, M.
| Point | (x, y) |
| A | (1, 1) |
| B | (4. 4) |
| C | (8, 4) |
| D | (5, 1) |
Table I
| Point | (0.5x, 0.5y) |
| E | (0.5, 0.5) |
| F | |
| G | |
| H |
Table II
| Point | (2x, 1.5y) |
| J | (2, 1.5) |
| K | |
| L | |
| M |
Table III
Draw parallelograms EFGH and JKLM on the same graph paper.
Plot the points (2, 4) and (4, 2) on a graph paper, then draw a line segment joining these two points.
