Advertisements
Advertisements
Question
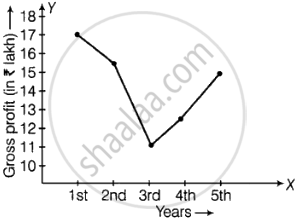
Draw the line graph using suitable scale to show the annual gross profit of a company for a period of five years.
| Year | 1st | 2nd | 3rd | 4th | 5th |
| Gross Profit (in Rs) |
17,00,000 | 15,50,000 | 11,40,000 | 12,10,000 | 14,90,000 |
Advertisements
Solution
We have taken years on X-axis and gross profit on Y-axis.
The line graph of an annual gross profit of a company for a period of five years are given below.
APPEARS IN
RELATED QUESTIONS
Plot the following points on a graph sheet. Verify if they lie on a line
K(2, 3), L(5, 3), M(5, 5), N(2, 5)
The following table gives the information regarding the number of persons employed to a piece of work and time taken to complete the work:
| Number of persons: | 2 | 4 | 6 | 8 |
| Time taken (in days): | 12 | 6 | 4 | 3 |
Plot a graph of this information.
The point (3, 4) is at a distance of ______.
Study the given map of a zoo and answer the following questions.

- Give the location of lions in the zoo.
- (D, f) and (C, d) represent locations of which animals in the zoo?
- Where are the toilets located?
- Give the location of canteen.
Write the x-coordinate (abscissa) of the given point.
(7, 3)
Write the y-coordinate (ordinate) of the given point.
(2, 7)
Plot the given points on a graph sheet and check if the points lie on a straight line. If not, name the shape they form when joined in the given order.
(1, 1), (1, 2), (2, 1), (2, 2)
Make a line graph for the area of a square as per the given table.
| Side (in cm) | 1 | 2 | 3 | 4 |
| Area (in cm2) | 1 | 4 | 9 | 16 |
Is it a linear graph?
Explain the situations represented by the following distance-time graph.

