Advertisements
Advertisements
Question
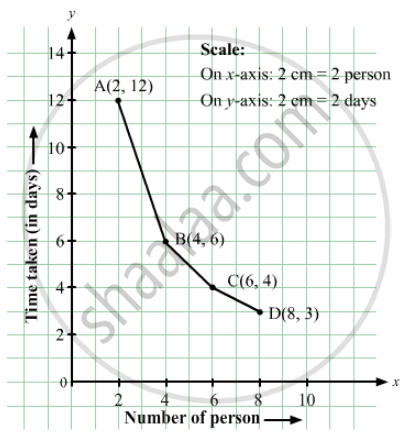
The following table gives the information regarding the number of persons employed to a piece of work and time taken to complete the work:
| Number of persons: | 2 | 4 | 6 | 8 |
| Time taken (in days): | 12 | 6 | 4 | 3 |
Plot a graph of this information.
Advertisements
Solution
Here, number of persons is an independent variable and time taken is a dependent variable. So, we take the number of persons on the x-axis and time taken on the y-axis.
Let us choose the following scale:
On x-axis: 2 cm = 2 persons
On y-axis: 2 cm = 2 days
Now, let us plot (2, 12), (4, 6), (6, 4), (8, 3). These points are joined to get the graph representing the given information as shown in the figure below.
RELATED QUESTIONS
Decide which of the following statements is true and which is false. Give reasons for your answer.
The coordinates of the origin are (0, 0).
In the given graph the coordinates of point x are ______.
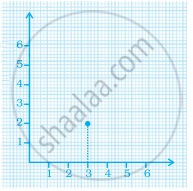
In the given graph the letter that indicates the point (0, 3) is ______.

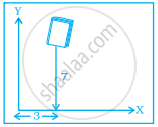
In the given figure the position of the book on the table may be given by ______.
For the point (5, 2), the distance from the x-axis is ______ units.
Write the y-coordinate (ordinate) of the given point.
(4, 0)
If y-coordinate is 3 times x-coordinate, form a table for it and draw a graph.
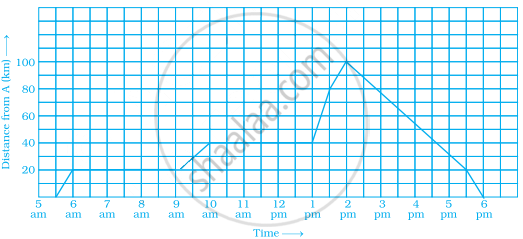
Explain the situations represented by the following distance-time graph.

A man started his journey on his car from location A and came back. The given graph shows his position at different times during the whole journey.
- At what time did he start and end his journey?
- What was the total duration of journey?
- Which journey, forward or return, was of longer duration?
- For how many hours did he not move?
- At what time did he have the fastest speed?
The table shows the data collected for Dhruv’s walking on a road.
| Time (in minutes) |
0 | 5 | 10 | 15 | 20 | 25 |
| Distance (in km) |
0 | 0.5 | 1 | 1.25 | 1.5 | 1.75 |
- Plot a line graph for the given data using a suitable scale.
- In what time periods did Dhruv make the most progress?
