Advertisements
Advertisements
प्रश्न
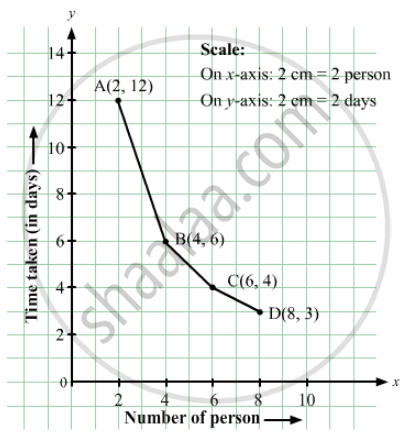
The following table gives the information regarding the number of persons employed to a piece of work and time taken to complete the work:
| Number of persons: | 2 | 4 | 6 | 8 |
| Time taken (in days): | 12 | 6 | 4 | 3 |
Plot a graph of this information.
Advertisements
उत्तर
Here, number of persons is an independent variable and time taken is a dependent variable. So, we take the number of persons on the x-axis and time taken on the y-axis.
Let us choose the following scale:
On x-axis: 2 cm = 2 persons
On y-axis: 2 cm = 2 days
Now, let us plot (2, 12), (4, 6), (6, 4), (8, 3). These points are joined to get the graph representing the given information as shown in the figure below.
संबंधित प्रश्न
Find the coordinates of points P, Q, R and S in Fig. 27.8.

The process of fixing a point with the help of the coordinates is known as ______ of the point.
In the point (4, 7), 4 denotes the ______.
If y-coordinate is 3 times x-coordinate, form a table for it and draw a graph.
Find the coordinates of the vertices of the given figures.

Study the graph given below of a person who started from his home and returned at the end of the day. Answer the questions that follow.

- At what time did the person start from his home?
- How much distance did he travel in the first four hours of his journey?
- What was he doing from 3 pm to 5 pm?
- What was the total distance travelled by him throughout the day?
- Calculate the distance covered by him in the first 8 hours of his journey.
- At what time did he cover 16 km of his journey?
- Calculate the average speed of the man from (a) A to B (b) B to C.
- At what time did he return home?
Locate the points P(3, 4), Q(1, 0), R(0, 4), S(4, 1) on a graph sheet and write the coordinates of the point of intersection of line segments PQ and RS.
The following is the time-distance graph of Sneha’s walking.

- When does Sneha make the least progress? Explain your reasoning.
- Find her average speed in km/hour.
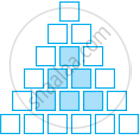
Sonal and Anmol then made another sequence of the designs. Three of the designs are shown below.
 |
 |
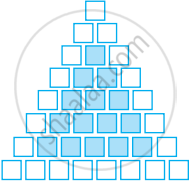 |
(a) Complete the table.
| Rows, r | 4 | 6 | 8 |
| Number of white Tiles, w | 9 | ||
| Number of Purple Tiles, p | 1 |
(b) Draw a graph of rows and number of white tiles. Draw another graph of the number of rows and the number of purple tiles. Put the number of rows on the horizontal axis.
(c) Which graph is linear?
