Advertisements
Advertisements
प्रश्न
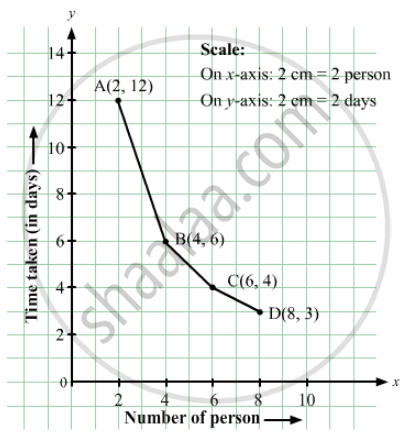
The following table gives the information regarding the number of persons employed to a piece of work and time taken to complete the work:
| Number of persons: | 2 | 4 | 6 | 8 |
| Time taken (in days): | 12 | 6 | 4 | 3 |
Plot a graph of this information.
Advertisements
उत्तर
Here, number of persons is an independent variable and time taken is a dependent variable. So, we take the number of persons on the x-axis and time taken on the y-axis.
Let us choose the following scale:
On x-axis: 2 cm = 2 persons
On y-axis: 2 cm = 2 days
Now, let us plot (2, 12), (4, 6), (6, 4), (8, 3). These points are joined to get the graph representing the given information as shown in the figure below.

APPEARS IN
संबंधित प्रश्न
Decide which of the following statements is true and which is false. Give reasons for your answer.
Points whose x and y coordinates are equal, lie on a line passing through the origin.
The point (3, 4) is at a distance of ______.
In the point (4, 7), 4 denotes the ______.
For fixing a point on the graph sheet we need two coordinates.
The coordinates of the origin are (0, 0).
The table given below shows the temperatures recorded on a day at different times.

Observe the table and answer the following questions.
- What is the temperature at 8 am?
- At what time is the temperature 3°C?
- During which hour did the temperature fall?
- What is the change in temperature between 7 am and 10 am?
- During which hour was there a constant temperature?
Extend the line segment on both sides to meet the coordinate axes. What are the coordinates of the points where this line meets the x-axis and the y-axis?
Ajita starts off from home at 07.00 hours with her father on a scooter that goes at a uniform speed of 30 km/h and drops her at her school after half an hour. She stays in the school till 13.30 hours and takes an auto-rickshaw to return home. The rickshaw has a uniform speed of 10 km/h. Draw the graph for the above situation and also determine the distance of Ajita’s school from her house.
This graph shows the per cent of students who dropped out of school after completing High School. The point labelled A shows that, in 1996, about 4.7% of students dropped out.

- In which year was the dropout the rate highest? In which year was it the lowest?
- When did the per cent of students who dropped out of high school first fall below 5%?
- About what per cent of students dropped out of high school in 2007? About what per cent of students stayed in high school in 2008?
Observe the toothpick pattern given below:
(a) Imagine that this pattern continues. Complete the table to show the number of toothpicks in the first six terms.
| Pattern | 1 | 2 | 3 | 4 | 5 | 6 |
| Toothpicks | 4 | 13 |
(b) Make a graph by taking the pattern numbers on the horizontal axis and the number of toothpicks on the vertical axis. Make the horizontal axis from 0 to 10 and the vertical axis from 0 to 30.
(c) Use your graph to predict the number of toothpicks in patterns 7 and 8. Check your answers by actually drawing them.
(d) Would it make sense to join the points on this graph? Explain.
