मराठी

Plot the Following Points on a Graph Sheet. Verify If They Lie on a Line K(2, 3), L(5, 3), M(5, 5), N(2, 5)

Advertisements
Advertisements

प्रश्न

Plot the following points on a graph sheet. Verify if they lie on a line

K(2, 3), L(5, 3), M(5, 5), N(2, 5)

Advertisements

उत्तर

We can plot the given points and join the consecutive points on a graph paper as follows.
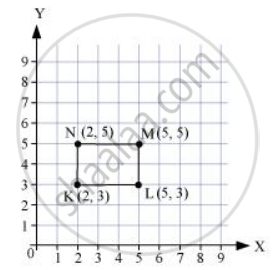
Hence, points K, L, M, and N are not lying on the same line.

shaalaa.com
  या प्रश्नात किंवा उत्तरात काही त्रुटी आहे का?

व्हिडिओ ट्यूटोरियलVIEW ALL [1]

संबंधित प्रश्‍न

Decide which of the following statements is true and which is false. Give reasons for your answer.

A point whose y-coordinate is zero, will lie on x-axis.


Decide which of the following statements is true and which is false. Give reasons for your answer.

Points whose x and y coordinates are equal, lie on a line passing through the origin.


Plot the following points and verify if they lie on a line. If they lie on a line, name it.
(0, 2), (0, 5), (0, 6), (0, 3.5)

Plot the given points on a graph sheet.

  1. (5, 4)
  2. (2, 0)
  3. (3, 1)
  4. (0, 4)
  5. (4, 5)

Write the x-coordinate (abscissa) of the given point.

(5, 7)


Study the graph given below of a person who started from his home and returned at the end of the day. Answer the questions that follow.

  1. At what time did the person start from his home?
  2. How much distance did he travel in the first four hours of his journey?
  3. What was he doing from 3 pm to 5 pm?
  4. What was the total distance travelled by him throughout the day?
  5. Calculate the distance covered by him in the first 8 hours of his journey.
  6. At what time did he cover 16 km of his journey?
  7. Calculate the average speed of the man from (a) A to B (b) B to C.
  8. At what time did he return home?

Locate the points A(1, 2), B(4, 2) and C(1, 4) on a graph sheet taking suitable axes. Write the coordinates of the fourth point D to complete the rectangle ABCD.


The graph given below compares the sales of ice creams of two vendors for a week.


Observe the graph and answer the following questions.

  1. Which vendor has sold more icecreams on Friday?
  2. For which day was the sales same for both the vendors?
  3. On which day did the sale of vendor A increase the most as compared to the previous day?
  4. On which day was the difference in sales the maximum?
  5. On which two days was the sales same for vendor B?

Draw a parallelogram ABCD on a graph paper with the coordinates given in Table I. Use this table to complete Tables II and III to get the coordinates of E, F, G, H and J, K, L, M.

Point (x, y)
A (1, 1)
B (4. 4)
C (8, 4)
D (5, 1)

     Table I

Point (0.5x, 0.5y)
E (0.5, 0.5)
F  
G  
H  

     Table II

Point (2x, 1.5y)
J (2, 1.5)
K  
L  
M  

    Table III

Draw parallelograms EFGH and JKLM on the same graph paper.

Plot the points (2, 4) and (4, 2) on a graph paper, then draw a line segment joining these two points.


Observe the given graph carefully and complete the table given below.

x 1 2 3 4 5
y          


Share
Notifications

Englishहिंदीमराठी


      Forgot password?
Use app×