Advertisements
Advertisements
प्रश्न
Find the coordinates of the vertices of the given figures.

Advertisements
उत्तर
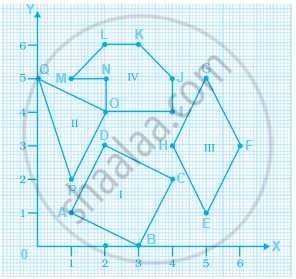
- (1, 1)
- (3, 0)
- (4, 2)
- (2, 3)
- (5, 1)
- (6, 3)
- (5, 5)
- (4, 3)
- (4, 4)
- (4, 5)
- (3, 6)
- (2, 6)
- (1, 5)
- (2, 5)
- (2, 4)
- (1, 2)
- (0, 5)
APPEARS IN
संबंधित प्रश्न
Plot the following points on a graph sheet. Verify if they lie on a line
K(2, 3), L(5, 3), M(5, 5), N(2, 5)
Locate the points:
(1, 3), (2, 3), (3, 3), (4, 3)

The distance of any point from the y-axis is the ______ coordinate.
In the point (4, 7), 4 denotes the ______.
Locate the points A(1, 2), B(4, 2) and C(1, 4) on a graph sheet taking suitable axes. Write the coordinates of the fourth point D to complete the rectangle ABCD.
The following table gives the growth chart of a child.
| Height (in cm) | 75 | 90 | 110 | 120 | 130 |
| Age (in years) | 2 | 4 | 6 | 8 | 10 |
Draw a line graph for the table and answer the questions that follow.
- What is the height at the age of 5 years?
- How much taller was the child at the age of 10 than at the age of 6?
- Between which two consecutive periods did the child grow more faster?
Extend the line segment on both sides to meet the coordinate axes. What are the coordinates of the points where this line meets the x-axis and the y-axis?
The table shows the data collected for Dhruv’s walking on a road.
| Time (in minutes) |
0 | 5 | 10 | 15 | 20 | 25 |
| Distance (in km) |
0 | 0.5 | 1 | 1.25 | 1.5 | 1.75 |
- Plot a line graph for the given data using a suitable scale.
- In what time periods did Dhruv make the most progress?
Consider this input/output table.
| Input | 1 | 2 | 4 | 5 | 7 |
| Output | 2 | 5 | 11 | 14 | 20 |
- Graph the values from the table by taking Input along horizontal axis from 0 to 8 and Output along vertical axis from 0 to 24.
- Use your graph to predict the outputs for inputs of 3 and 8.
