Advertisements
Advertisements
प्रश्न
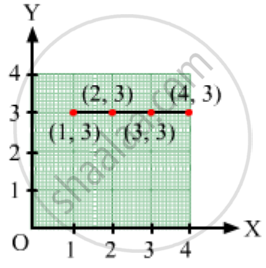
Locate the points:
(1, 3), (2, 3), (3, 3), (4, 3)
Advertisements
उत्तर
Follow the steps mentioned in point (i).
संबंधित प्रश्न
Write the coordinates of the vertices of each of these adjoining figures.

Plot the points (5, 0), (5, 1), (5, 8). Do they lie on a line? What is your observation?
Locate the points:
(1, 1), (1, 2), (1, 3), (1, 4)
Decide which of the following statement is true and which is false. Give reasons for your answer.
A point whose x-coordinate is zero, will lie on the y-axis.
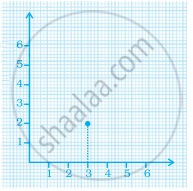
In the given graph the coordinates of point x are ______.
The point where the two axes intersect is called the ______.
For fixing a point on the graph sheet we need two coordinates.
Write the x-coordinate (abscissa) of the given point.
(0, 5)
Explain the situations represented by the following distance-time graph.

Extend the line segment on both sides to meet the coordinate axes. What are the coordinates of the points where this line meets the x-axis and the y-axis?
