Advertisements
Advertisements
प्रश्न
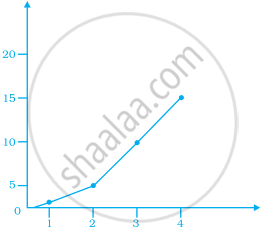
Explain the situations represented by the following distance-time graph.

Advertisements
उत्तर
Here x-axis represents time and y-axis represents distance.
In the graph, we observe that initially graph increases steadily i.e. at uniform speed and after a certain period of time, it comes to rest position i.e. constant.
APPEARS IN
संबंधित प्रश्न
Plot the following points on a graph sheet. Verify if they lie on a line
A(4, 0), B(4, 2), C(4, 6), D(4, 2.5)
Decide which of the following statement is true and which is false. Give reasons for your answer.
A point whose x-coordinate is zero, will lie on the y-axis.
In the coordinates of a point, the second number denotes the ______.
The distance of any point from the x-axis is called the x-coordinate.
Write the y-coordinate (ordinate) of the given point.
(2, 7)
Plot the given points on a graph sheet and check if the points lie on a straight line. If not, name the shape they form when joined in the given order.
(4, 2), (2, 4), (3, 3), (5, 4)
If y-coordinate is 3 times x-coordinate, form a table for it and draw a graph.
Locate the points A(1, 2), B(4, 2) and C(1, 4) on a graph sheet taking suitable axes. Write the coordinates of the fourth point D to complete the rectangle ABCD.
Observe the given graph carefully and complete the table given below.
| x | 1 | 2 | 3 | 4 | 5 |
| y |