Advertisements
Advertisements
प्रश्न
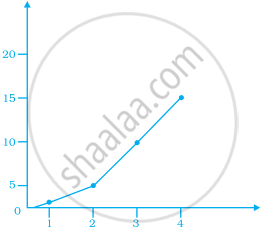
Observe the given graph carefully and complete the table given below.
| x | 1 | 2 | 3 | 4 | 5 |
| y |
Advertisements
उत्तर
Watching the graph carefully, we see that at
x = 1, y = 2.5
x = 2, y = 5
x = 3, y = 10
x = 4, y = 15
x = 5, y = 20
∴ We have the following table.
| x | 1 | 2 | 3 | 4 | 5 |
| y | 2.5 | 5 | 10 | 15 | 20 |
APPEARS IN
संबंधित प्रश्न
The following table gives the information regarding the number of persons employed to a piece of work and time taken to complete the work:
| Number of persons: | 2 | 4 | 6 | 8 |
| Time taken (in days): | 12 | 6 | 4 | 3 |
Plot a graph of this information.
A point which lies on both the axis is ______.
______ displays data that changes continuously over periods of time.
Study the given map of a zoo and answer the following questions.

- Give the location of lions in the zoo.
- (D, f) and (C, d) represent locations of which animals in the zoo?
- Where are the toilets located?
- Give the location of canteen.
Explain the situations represented by the following distance-time graph.

Find the coordinates of the vertices of the given figures.

The following table gives the growth chart of a child.
| Height (in cm) | 75 | 90 | 110 | 120 | 130 |
| Age (in years) | 2 | 4 | 6 | 8 | 10 |
Draw a line graph for the table and answer the questions that follow.
- What is the height at the age of 5 years?
- How much taller was the child at the age of 10 than at the age of 6?
- Between which two consecutive periods did the child grow more faster?
Draw the line graph using suitable scale to show the annual gross profit of a company for a period of five years.
| Year | 1st | 2nd | 3rd | 4th | 5th |
| Gross Profit (in Rs) |
17,00,000 | 15,50,000 | 11,40,000 | 12,10,000 | 14,90,000 |
This graph shows a map of an island just off the coast of a continent. The point labelled B represents a major city on the coast. The distance between grid lines represents 1 km.
Point A represents a resort that is located 5 km East and 3 km North of Point B. The values 5 and 3 are the coordinates of Point A. The coordinates can be given as the ordered pair (5, 3), where 5 is the horizontal coordinate and 3 is the vertical coordinate.
(i) On a copy of the map, mark the point that is 3 km East and 5 km North of Point B and label it S. Is Point S in the water or on the island? Is Point S in the same place as Point A?
(ii) Mark the point that is 7 km east and 5 km north of Point B and label it C. Then mark the point that is 5 km east and 7 km north of Point B and label it D. Are Points C and D in the same place? Give the coordinates of Points C and D.
(iii) Which point is in the water, (2, 7) or (7, 2)? Mark the point which is in water on your map and label it E.
(iv) Give the coordinates of two points on the island that are exactly 2 km from Point A.
(v) Give the coordinates of the point that is halfway between Points L and P.
(vi) List three points on the island with their x-coordinates greater than 8.
(vii) List three points on the island with a y-coordinate less than 4.
The graph given below compares the price (in Rs) and weight of 6 bags (in kg) of sugar of different brands A, B, C, D, E, F.

- Which brand(s) costs/cost more than Brand D?
- Bag of which brand of sugar is the heaviest?
- Which brands weigh the same?
- Which brands are heavier than brand B?
- Which bag is the lightest?
- Which bags are of the same price?
