Advertisements
Advertisements
प्रश्न
In the given graph the letter that indicates the point (0, 3) is ______.

पर्याय
P
Q
R
S
Advertisements
उत्तर
In the given graph the letter that indicates the point (0, 3) is R.
Explanation:
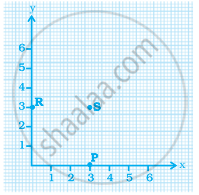
The letter that indicates the point (0, 3) is R as it lies on the Y-axis at a distance of 3 units from the origin.
The coordinates of the point P and S are (3, 0) and (3, 3), respectively.
APPEARS IN
संबंधित प्रश्न
State whether True or False. Correct those are false.
The coordinates of the origin are (0, 0).
Decide which of the following statements is true and which is false. Give reasons for your answer.
The coordinates of the origin are (0, 0).
A point which lies on both the axis is ______.
For fixing a point on the graph sheet we need two coordinates.
Write the x-coordinate (abscissa) of the given point.
(0, 5)
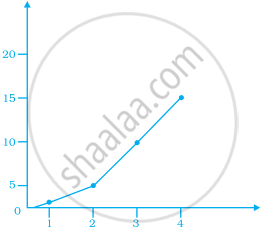
If y-coordinate is 3 times x-coordinate, form a table for it and draw a graph.
The table shows the data collected for Dhruv’s walking on a road.
| Time (in minutes) |
0 | 5 | 10 | 15 | 20 | 25 |
| Distance (in km) |
0 | 0.5 | 1 | 1.25 | 1.5 | 1.75 |
- Plot a line graph for the given data using a suitable scale.
- In what time periods did Dhruv make the most progress?
Observe the given graph carefully and complete the table given below.
| x | 1 | 2 | 3 | 4 | 5 |
| y |
The graph given below compares the price (in Rs) and weight of 6 bags (in kg) of sugar of different brands A, B, C, D, E, F.

- Which brand(s) costs/cost more than Brand D?
- Bag of which brand of sugar is the heaviest?
- Which brands weigh the same?
- Which brands are heavier than brand B?
- Which bag is the lightest?
- Which bags are of the same price?
Sonal and Anmol made a sequence of tile designs from square white tiles surrounding one square purple tile. The purple tiles come in many sizes. Three of the designs are shown below.
(a) Copy and complete the table
| Side Length of Purple Titles | 1 | 2 | 3 | 4 | 5 | 10 | 100 |
| Number of white Tiles in Border |
 |
 |
 |
(b) Draw a graph using the first five pairs of numbers in your table.
(c) Do the points lie on a line?
