Advertisements
Advertisements
प्रश्न
State whether True or False. Correct those are false.
The coordinates of the origin are (0, 0).
पर्याय
True
False
Advertisements
उत्तर
True
संबंधित प्रश्न
Plot the points (5, 0), (5, 1), (5, 8). Do they lie on a line? What is your observation?
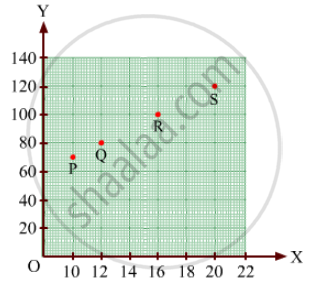
Find the coordinates of points P, Q, R and S in Fig. 27.8.
In the given graph the coordinates of point x are ______.
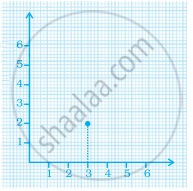
In the coordinates of a point, the second number denotes the ______.
The distance of any point from the x-axis is called the x-coordinate.
From the given graph, choose the letters that indicate the location of the points given below.
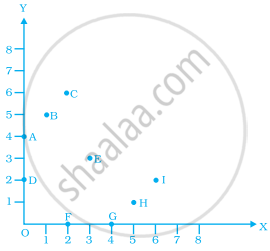
- (2, 0)
- (0, 4)
- (5, 1)
- (2, 6)
- (3, 3)
Write the x-coordinate (abscissa) of the given point.
(7, 3)
Locate the points A(1, 2), B(4, 2) and C(1, 4) on a graph sheet taking suitable axes. Write the coordinates of the fourth point D to complete the rectangle ABCD.
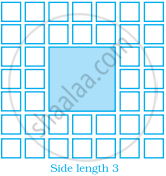
Sonal and Anmol made a sequence of tile designs from square white tiles surrounding one square purple tile. The purple tiles come in many sizes. Three of the designs are shown below.
(a) Copy and complete the table
| Side Length of Purple Titles | 1 | 2 | 3 | 4 | 5 | 10 | 100 |
| Number of white Tiles in Border |
 |
 |
 |
(b) Draw a graph using the first five pairs of numbers in your table.
(c) Do the points lie on a line?
