Advertisements
Advertisements
प्रश्न
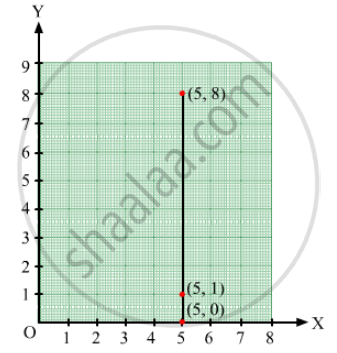
Plot the points (5, 0), (5, 1), (5, 8). Do they lie on a line? What is your observation?
Advertisements
उत्तर
Take a point O on the graph paper and draw horizontal and vertical lines OX and OY respectively.
Then, let on the x-axis and y axis 1 cm represents 1 unit.
In order to plot point (5, 0), we start from the origin O and move 5 cm along OX. The point we arrive at is point (5,0).
To plot point (5, 1), we move 5 cm along OX and 1 cm along OY. The point we arrive at is point (5,1).
To plot point (5,8), we move 5 cm along OX and 8 cm along OY. The point we arrive at is point (5,8).
From the graph below, it can be seen that the points lie on a line parallel to y-axis. This is because they have the same x-coordinate.
संबंधित प्रश्न
Plot the following points on a graph sheet. Verify if they lie on a line
P(1, 1), Q(2, 2), R(3, 3), S(4, 4)
Draw the line passing through (2, 3) and (3, 2). Find the coordinates of the points at which this line meets the x-axis and y-axis.
Write the coordinates of the vertices of each of these adjoining figures.

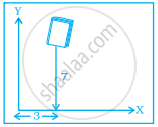
In the given figure the position of the book on the table may be given by ______.
A point has 5 as its x–coordinate and 4 as its y–coordinate. Then the coordinates of the point are given by ______.
The distance of any point from the x-axis is called the x-coordinate.
Write the x-coordinate (abscissa) of the given point.
(7, 3)
Make a line graph for the area of a square as per the given table.
| Side (in cm) | 1 | 2 | 3 | 4 |
| Area (in cm2) | 1 | 4 | 9 | 16 |
Is it a linear graph?
Ajita starts off from home at 07.00 hours with her father on a scooter that goes at a uniform speed of 30 km/h and drops her at her school after half an hour. She stays in the school till 13.30 hours and takes an auto-rickshaw to return home. The rickshaw has a uniform speed of 10 km/h. Draw the graph for the above situation and also determine the distance of Ajita’s school from her house.
Draw the line graph using suitable scale to show the annual gross profit of a company for a period of five years.
| Year | 1st | 2nd | 3rd | 4th | 5th |
| Gross Profit (in Rs) |
17,00,000 | 15,50,000 | 11,40,000 | 12,10,000 | 14,90,000 |
