Advertisements
Advertisements
Question
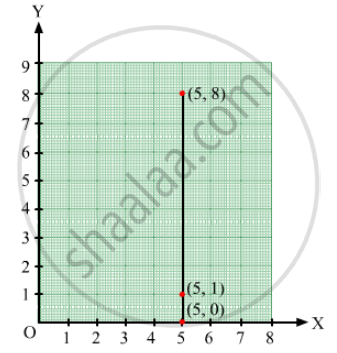
Plot the points (5, 0), (5, 1), (5, 8). Do they lie on a line? What is your observation?
Advertisements
Solution
Take a point O on the graph paper and draw horizontal and vertical lines OX and OY respectively.
Then, let on the x-axis and y axis 1 cm represents 1 unit.
In order to plot point (5, 0), we start from the origin O and move 5 cm along OX. The point we arrive at is point (5,0).
To plot point (5, 1), we move 5 cm along OX and 1 cm along OY. The point we arrive at is point (5,1).
To plot point (5,8), we move 5 cm along OX and 8 cm along OY. The point we arrive at is point (5,8).
From the graph below, it can be seen that the points lie on a line parallel to y-axis. This is because they have the same x-coordinate.
RELATED QUESTIONS
Locate the points:
(2, 1), (2, 2), (2, 3), (2, 4)
All points with y-coordinate as zero lie on the ______.
For the point (5, 2), the distance from the x-axis is ______ units.
Plot the given points on a graph sheet and check if the points lie on a straight line. If not, name the shape they form when joined in the given order.
(4, 2), (2, 4), (3, 3), (5, 4)
The table given below shows the temperatures recorded on a day at different times.

Observe the table and answer the following questions.
- What is the temperature at 8 am?
- At what time is the temperature 3°C?
- During which hour did the temperature fall?
- What is the change in temperature between 7 am and 10 am?
- During which hour was there a constant temperature?
Draw the line graph using suitable scale to show the annual gross profit of a company for a period of five years.
| Year | 1st | 2nd | 3rd | 4th | 5th |
| Gross Profit (in Rs) |
17,00,000 | 15,50,000 | 11,40,000 | 12,10,000 | 14,90,000 |
This graph shows the per cent of students who dropped out of school after completing High School. The point labelled A shows that, in 1996, about 4.7% of students dropped out.

- In which year was the dropout the rate highest? In which year was it the lowest?
- When did the per cent of students who dropped out of high school first fall below 5%?
- About what per cent of students dropped out of high school in 2007? About what per cent of students stayed in high school in 2008?
This graph shows a map of an island just off the coast of a continent. The point labelled B represents a major city on the coast. The distance between grid lines represents 1 km.
Point A represents a resort that is located 5 km East and 3 km North of Point B. The values 5 and 3 are the coordinates of Point A. The coordinates can be given as the ordered pair (5, 3), where 5 is the horizontal coordinate and 3 is the vertical coordinate.
(i) On a copy of the map, mark the point that is 3 km East and 5 km North of Point B and label it S. Is Point S in the water or on the island? Is Point S in the same place as Point A?
(ii) Mark the point that is 7 km east and 5 km north of Point B and label it C. Then mark the point that is 5 km east and 7 km north of Point B and label it D. Are Points C and D in the same place? Give the coordinates of Points C and D.
(iii) Which point is in the water, (2, 7) or (7, 2)? Mark the point which is in water on your map and label it E.
(iv) Give the coordinates of two points on the island that are exactly 2 km from Point A.
(v) Give the coordinates of the point that is halfway between Points L and P.
(vi) List three points on the island with their x-coordinates greater than 8.
(vii) List three points on the island with a y-coordinate less than 4.
The points on the graph below represent the height and weight of the donkey, dog, crocodile, and ostrich shown in the drawing.

- What are the two variables represented in the graph?
- Which point represents each animals? Explain.
