Advertisements
Advertisements
प्रश्न
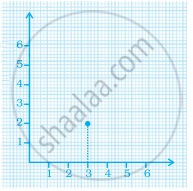
Plot the following points on a graph sheet. Verify if they lie on a line
P(1, 1), Q(2, 2), R(3, 3), S(4, 4)
Advertisements
उत्तर
We can plot the given points and join the consecutive points on a graph paper as follows.

Hence, points P, Q, R, and S lie on the same line
संबंधित प्रश्न
Find the coordinates of points P, Q, R and S in Fig. 27.8.

Write the coordinates of each of the vertices of each polygon in Fig. 27.9.

In the given graph the coordinates of point x are ______.
______ displays data that changes continuously over periods of time.
The y-coordinate of any point lying on the x-axis will be zero.
Write the x-coordinate (abscissa) of the given point.
(7, 3)
Write the y-coordinate (ordinate) of the given point.
(4, 0)
Locate the points P(3, 4), Q(1, 0), R(0, 4), S(4, 1) on a graph sheet and write the coordinates of the point of intersection of line segments PQ and RS.
The table given below shows the temperatures recorded on a day at different times.

Observe the table and answer the following questions.
- What is the temperature at 8 am?
- At what time is the temperature 3°C?
- During which hour did the temperature fall?
- What is the change in temperature between 7 am and 10 am?
- During which hour was there a constant temperature?
The following graph shows the journey made by two cyclists, one from town A to B and the other from town B to A.
- At what time did cyclist II rest? How long did the cyclist rest?
- Was cyclist II cycling faster or slower after the rest?
- At what time did the two cyclists meet?
- How far had cyclist II travelled when he met cyclist I?
- When cyclist II reached town A, how far was cyclist I from town B?

