Advertisements
Advertisements
Question
Plot the following points on a graph sheet. Verify if they lie on a line
P(1, 1), Q(2, 2), R(3, 3), S(4, 4)
Advertisements
Solution
We can plot the given points and join the consecutive points on a graph paper as follows.

Hence, points P, Q, R, and S lie on the same line
RELATED QUESTIONS
Plot the following points on a graph sheet. Verify if they lie on a line
K(2, 3), L(5, 3), M(5, 5), N(2, 5)
State whether True or False. Correct those are false.
A point whose y coordinate is zero and x-coordinate is 5 will lie on y-axis.
Locate the points:
(2, 1), (2, 2), (2, 3), (2, 4)
Find the coordinates of points P, Q, R and S in Fig. 27.8.

Write the coordinates of each of the vertices of each polygon in Fig. 27.9.

A point which lies on both the axis is ______.
Match the coordinates given in Column A with the items mentioned in Column B.
| Column A | Column B |
| (1) (0, 5) | (a) y coordinate is 2 × x - coordinate + 1. |
| (2) (2, 3) | (b) Coordinates of origin. |
| (3) (4, 8) | (c) Only y–coordinate is zero. |
| (4) (3, 7) | (d) The distance from x-axis is 5. |
| (5) (0, 0) | (e) y coordinate is double of x-coordinate. |
| (6) (5, 0) | (f) The distance from y-axis is 2. |
Extend the line segment on both sides to meet the coordinate axes. What are the coordinates of the points where this line meets the x-axis and the y-axis?
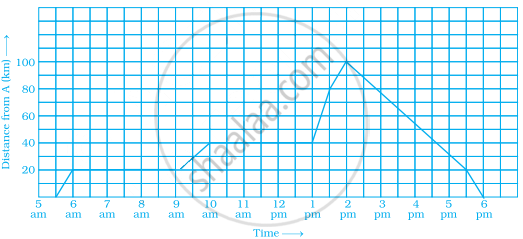
A man started his journey on his car from location A and came back. The given graph shows his position at different times during the whole journey.
- At what time did he start and end his journey?
- What was the total duration of journey?
- Which journey, forward or return, was of longer duration?
- For how many hours did he not move?
- At what time did he have the fastest speed?
Observe the toothpick pattern given below:
(a) Imagine that this pattern continues. Complete the table to show the number of toothpicks in the first six terms.
| Pattern | 1 | 2 | 3 | 4 | 5 | 6 |
| Toothpicks | 4 | 13 |
(b) Make a graph by taking the pattern numbers on the horizontal axis and the number of toothpicks on the vertical axis. Make the horizontal axis from 0 to 10 and the vertical axis from 0 to 30.
(c) Use your graph to predict the number of toothpicks in patterns 7 and 8. Check your answers by actually drawing them.
(d) Would it make sense to join the points on this graph? Explain.
