Advertisements
Advertisements
Question
Plot the following points on a graph sheet. Verify if they lie on a line
K(2, 3), L(5, 3), M(5, 5), N(2, 5)
Advertisements
Solution
We can plot the given points and join the consecutive points on a graph paper as follows.
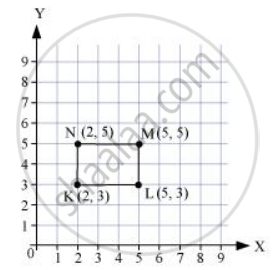
Hence, points K, L, M, and N are not lying on the same line.
RELATED QUESTIONS
Plot the points (5, 0), (5, 1), (5, 8). Do they lie on a line? What is your observation?
In the given graph the letter that indicates the point (0, 3) is ______.

The x-coordinate of any point lying on the y-axis will be ______.
The y-coordinate of any point lying on the x-axis will be zero.
Plot the given points on a graph sheet.
- (5, 4)
- (2, 0)
- (3, 1)
- (0, 4)
- (4, 5)
Make a line graph for the area of a square as per the given table.
| Side (in cm) | 1 | 2 | 3 | 4 |
| Area (in cm2) | 1 | 4 | 9 | 16 |
Is it a linear graph?
Explain the situations represented by the following distance-time graph.

The following graph shows the journey made by two cyclists, one from town A to B and the other from town B to A.
- At what time did cyclist II rest? How long did the cyclist rest?
- Was cyclist II cycling faster or slower after the rest?
- At what time did the two cyclists meet?
- How far had cyclist II travelled when he met cyclist I?
- When cyclist II reached town A, how far was cyclist I from town B?

Observe the toothpick pattern given below:
(a) Imagine that this pattern continues. Complete the table to show the number of toothpicks in the first six terms.
| Pattern | 1 | 2 | 3 | 4 | 5 | 6 |
| Toothpicks | 4 | 13 |
(b) Make a graph by taking the pattern numbers on the horizontal axis and the number of toothpicks on the vertical axis. Make the horizontal axis from 0 to 10 and the vertical axis from 0 to 30.
(c) Use your graph to predict the number of toothpicks in patterns 7 and 8. Check your answers by actually drawing them.
(d) Would it make sense to join the points on this graph? Explain.
The graph given below compares the price (in Rs) and weight of 6 bags (in kg) of sugar of different brands A, B, C, D, E, F.

- Which brand(s) costs/cost more than Brand D?
- Bag of which brand of sugar is the heaviest?
- Which brands weigh the same?
- Which brands are heavier than brand B?
- Which bag is the lightest?
- Which bags are of the same price?
