English

Make a line graph for the area of a square as per the given table. Side (in cm) 1 2 3 4 Area (in cm2) 1 4 9 16 Is it a linear graph?

Advertisements
Advertisements

Question

Make a line graph for the area of a square as per the given table.

Side (in cm) 1 2 3 4
Area (in cm2) 1 4 9 16

Is it a linear graph?

Graph
Advertisements

Solution
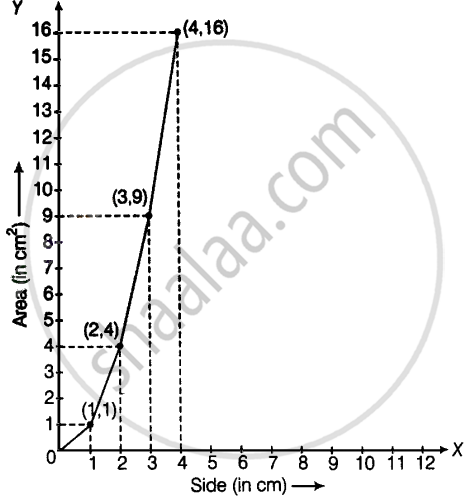

Yes, it is a linear graph.

shaalaa.com
  Is there an error in this question or solution?
Chapter 12: Introduct To Graphs - Exercise [Page 380]

APPEARS IN

NCERT Exemplar Mathematics Exemplar [English] Class 8
Chapter 12 Introduct To Graphs
Exercise | Q 45. | Page 380

Video TutorialsVIEW ALL [1]

RELATED QUESTIONS

Plot the following points on a graph sheet. Verify if they lie on a line

A(4, 0), B(4, 2), C(4, 6), D(4, 2.5)


Plot the following points on a graph sheet. Verify if they lie on a line

P(1, 1), Q(2, 2), R(3, 3), S(4, 4)


A point has 5 as its x–coordinate and 4 as its y–coordinate. Then the coordinates of the point are given by ______.


The ordinate of a point is its distance from the y-axis.


The points (3, 5) and (5, 3) represent the same point.


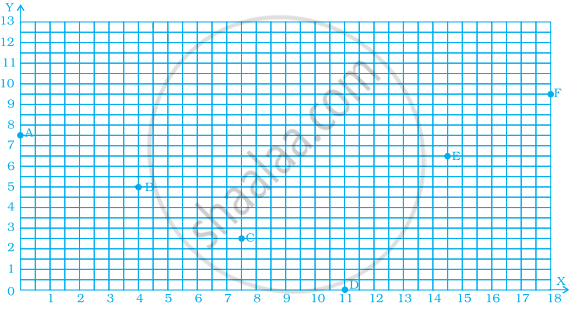
From the given graph, choose the letters that indicate the location of the points given below.

  1. (2, 0)
  2. (0, 4)
  3. (5, 1)
  4. (2, 6)
  5. (3, 3)

Draw a parallelogram ABCD on a graph paper with the coordinates given in Table I. Use this table to complete Tables II and III to get the coordinates of E, F, G, H and J, K, L, M.

Point (x, y)
A (1, 1)
B (4. 4)
C (8, 4)
D (5, 1)

     Table I

Point (0.5x, 0.5y)
E (0.5, 0.5)
F  
G  
H  

     Table II

Point (2x, 1.5y)
J (2, 1.5)
K  
L  
M  

    Table III

Draw parallelograms EFGH and JKLM on the same graph paper.

Plot the points (2, 4) and (4, 2) on a graph paper, then draw a line segment joining these two points.


Extend the line segment on both sides to meet the coordinate axes. What are the coordinates of the points where this line meets the x-axis and the y-axis?


Ajita starts off from home at 07.00 hours with her father on a scooter that goes at a uniform speed of 30 km/h and drops her at her school after half an hour. She stays in the school till 13.30 hours and takes an auto-rickshaw to return home. The rickshaw has a uniform speed of 10 km/h. Draw the graph for the above situation and also determine the distance of Ajita’s school from her house.


This graph shows the per cent of students who dropped out of school after completing High School. The point labelled A shows that, in 1996, about 4.7% of students dropped out.

  1. In which year was the dropout the rate highest? In which year was it the lowest?
  2. When did the per cent of students who dropped out of high school first fall below 5%?
  3. About what per cent of students dropped out of high school in 2007? About what per cent of students stayed in high school in 2008?

Share
Notifications

Englishहिंदीमराठी


      Forgot password?
Use app×