Advertisements
Advertisements
Question
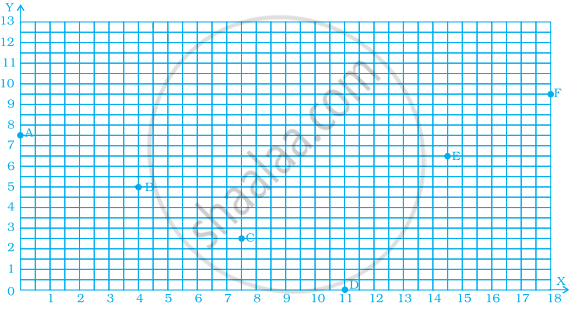
Find the coordinates of all letters in the graph given below.
Advertisements
Solution
The point A is on the Y-axis at a distance of 7.5 units from the origin.
∴ The coordinates are (0, 7.5).
The point B is at a distance of 4 units from Y-axis and 5 units from X-axis.
∴ The coordinates of B are (4, 5).
The point C is at a distance of 7.5 units from Y-axis and 2.5 units from X-axis.
∴ The coordinates of C denotes (7.5, 2.5).
The point D lies on X-axis at a distance of 11 units from the origin.
∴ The coordinates of D are (11, 0).
The point E is at a distance of 14.5 units from Y-axis and 6.5 units from X-axis.
∴ The coordinates of E are (14.5, 6.5).
The point F is at a distance of 18 units from Y-axis and 9.5 units from X-axis.
∴ The coordinates of F are (18, 9.5).
APPEARS IN
RELATED QUESTIONS
Plot the following points on a graph sheet. Verify if they lie on a line
P(1, 1), Q(2, 2), R(3, 3), S(4, 4)
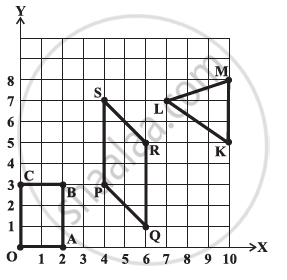
Write the coordinates of the vertices of each of these adjoining figures.
Locate the points:
(2, 1), (2, 2), (2, 3), (2, 4)
The following table gives the information regarding the number of persons employed to a piece of work and time taken to complete the work:
| Number of persons: | 2 | 4 | 6 | 8 |
| Time taken (in days): | 12 | 6 | 4 | 3 |
Plot a graph of this information.
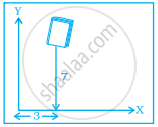
In the given figure the position of the book on the table may be given by ______.
The ordinate of a point is its distance from the y-axis.
The coordinates of the origin are (0, 0).
The table given below shows the temperatures recorded on a day at different times.
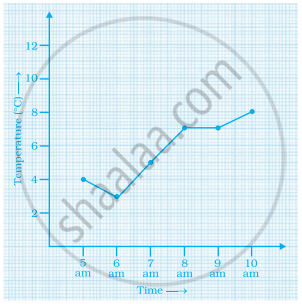
Observe the table and answer the following questions.
- What is the temperature at 8 am?
- At what time is the temperature 3°C?
- During which hour did the temperature fall?
- What is the change in temperature between 7 am and 10 am?
- During which hour was there a constant temperature?
The following is the time-distance graph of Sneha’s walking.
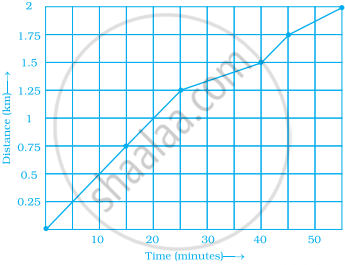
- When does Sneha make the least progress? Explain your reasoning.
- Find her average speed in km/hour.
Ajita starts off from home at 07.00 hours with her father on a scooter that goes at a uniform speed of 30 km/h and drops her at her school after half an hour. She stays in the school till 13.30 hours and takes an auto-rickshaw to return home. The rickshaw has a uniform speed of 10 km/h. Draw the graph for the above situation and also determine the distance of Ajita’s school from her house.
