Advertisements
Advertisements
प्रश्न
Find the coordinates of all letters in the graph given below.

Advertisements
उत्तर
The point A is on the Y-axis at a distance of 7.5 units from the origin.
∴ The coordinates are (0, 7.5).
The point B is at a distance of 4 units from Y-axis and 5 units from X-axis.
∴ The coordinates of B are (4, 5).
The point C is at a distance of 7.5 units from Y-axis and 2.5 units from X-axis.
∴ The coordinates of C denotes (7.5, 2.5).
The point D lies on X-axis at a distance of 11 units from the origin.
∴ The coordinates of D are (11, 0).
The point E is at a distance of 14.5 units from Y-axis and 6.5 units from X-axis.
∴ The coordinates of E are (14.5, 6.5).
The point F is at a distance of 18 units from Y-axis and 9.5 units from X-axis.
∴ The coordinates of F are (18, 9.5).
APPEARS IN
संबंधित प्रश्न
Write the coordinates of the vertices of each of these adjoining figures.

Decide which of the following statements is true and which is false. Give reasons for your answer.
A point whose y-coordinate is zero, will lie on x-axis.

In the given graph the letter that indicates the point (0, 3) is ______.

The point (3, 4) is at a distance of ______.
For fixing a point on the graph sheet we need two coordinates.
If y-coordinate is 3 times x-coordinate, form a table for it and draw a graph.
Explain the situations represented by the following distance-time graph.

Observe the toothpick pattern given below:
(a) Imagine that this pattern continues. Complete the table to show the number of toothpicks in the first six terms.
| Pattern | 1 | 2 | 3 | 4 | 5 | 6 |
| Toothpicks | 4 | 13 |
(b) Make a graph by taking the pattern numbers on the horizontal axis and the number of toothpicks on the vertical axis. Make the horizontal axis from 0 to 10 and the vertical axis from 0 to 30.
(c) Use your graph to predict the number of toothpicks in patterns 7 and 8. Check your answers by actually drawing them.
(d) Would it make sense to join the points on this graph? Explain.
The two graphs below compare Car A and Car B. The left graph shows the relationship between age and value. The right graph shows the relationship between size and maximum speed.
 |
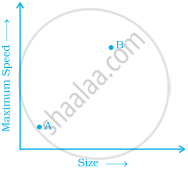 |
Use the graphs to determine whether each statement is true or false, and explain your answer.
- The older car is less valuable.
- The faster car is larger.
- The larger car is older.
- The faster car is older.
- The more valuable car is slower.
