हिंदी

Decide Which of the Following Statements is True and Which is False. Give Reasons for Your Answer. a Point Whose Y-coordinate is Zero, Will Lie on X-axis. - Mathematics

Advertisements
Advertisements

प्रश्न

Decide which of the following statements is true and which is false. Give reasons for your answer.

A point whose y-coordinate is zero, will lie on x-axis.

संक्षेप में उत्तर
Advertisements

उत्तर

The examples of points having y-coordinate as zero are (3,0), (6,0), (9,0). This can be represented in the following manner:

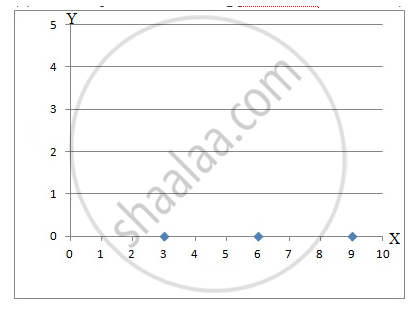
From figure above, it can be seen that these points lie on the x-axis. Hence, the statement is true.

shaalaa.com
  क्या इस प्रश्न या उत्तर में कोई त्रुटि है?
अध्याय 27: Introduction to Graphs - Exercise 27.1 [पृष्ठ ७]

APPEARS IN

आरडी शर्मा Mathematics [English] Class 8
अध्याय 27 Introduction to Graphs
Exercise 27.1 | Q 7.2 | पृष्ठ ७

वीडियो ट्यूटोरियलVIEW ALL [1]

संबंधित प्रश्न

Plot the following points on a graph sheet. Verify if they lie on a line

A(4, 0), B(4, 2), C(4, 6), D(4, 2.5)


In the given figure the position of the book on the table may be given by ______.


Match the coordinates given in Column A with the items mentioned in Column B.

Column A Column B
(1) (0, 5) (a) y coordinate is 2 × x - coordinate + 1.
(2) (2, 3) (b) Coordinates of origin.
(3) (4, 8) (c) Only y–coordinate is zero.
(4) (3, 7) (d) The distance from x-axis is 5.
(5) (0, 0) (e) y coordinate is double of x-coordinate.
(6) (5, 0) (f) The distance from y-axis is 2.

Plot the given points on a graph sheet.

  1. (5, 4)
  2. (2, 0)
  3. (3, 1)
  4. (0, 4)
  5. (4, 5)

Study the given map of a zoo and answer the following questions.

  1. Give the location of lions in the zoo.
  2. (D, f) and (C, d) represent locations of which animals in the zoo?
  3. Where are the toilets located?
  4. Give the location of canteen.

Plot the given points on a graph sheet and check if the points lie on a straight line. If not, name the shape they form when joined in the given order.

(4, 2), (2, 4), (3, 3), (5, 4)


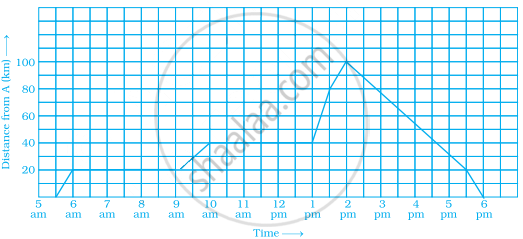
Explain the situations represented by the following distance-time graph.


Draw a parallelogram ABCD on a graph paper with the coordinates given in Table I. Use this table to complete Tables II and III to get the coordinates of E, F, G, H and J, K, L, M.

Point (x, y)
A (1, 1)
B (4. 4)
C (8, 4)
D (5, 1)

     Table I

Point (0.5x, 0.5y)
E (0.5, 0.5)
F  
G  
H  

     Table II

Point (2x, 1.5y)
J (2, 1.5)
K  
L  
M  

    Table III

Draw parallelograms EFGH and JKLM on the same graph paper.

Plot the points (2, 4) and (4, 2) on a graph paper, then draw a line segment joining these two points.


Consider this input/output table.

Input 1 2 4 5 7
Output 2 5 11 14 20
  1. Graph the values from the table by taking Input along horizontal axis from 0 to 8 and Output along vertical axis from 0 to 24.
  2. Use your graph to predict the outputs for inputs of 3 and 8.

Sonal and Anmol then made another sequence of the designs. Three of the designs are shown below.

(a) Complete the table.

Rows, r 4 6 8
Number of white Tiles, w 9    
Number of Purple Tiles, p 1    

(b) Draw a graph of rows and number of white tiles. Draw another graph of the number of rows and the number of purple tiles. Put the number of rows on the horizontal axis.

(c) Which graph is linear?


Share
Notifications

Englishहिंदीमराठी


      Forgot password?
Use app×