Advertisements
Advertisements
प्रश्न
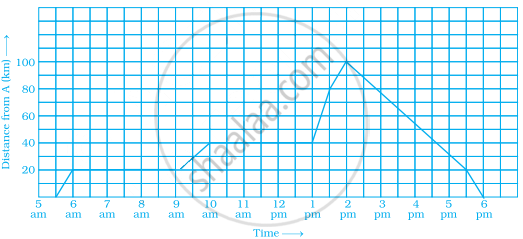
Explain the situations represented by the following distance-time graph.

Advertisements
उत्तर
Here x-axis represents time and y-axis represents distance.
In the first graph, we observe that when time changes, distance also varies at the same rate.
When we move along time axis away from the origin, then the graph is strictly increasing.
Hence, the object is moving at a uniform speed.
APPEARS IN
संबंधित प्रश्न
State whether True or False. Correct those are false.
A point whose x coordinate is zero and y-coordinate is non-zero will lie on the y-axis.
Find the coordinates of points P, Q, R and S in Fig. 27.8.

______ displays data that changes continuously over periods of time.
We need ______ coordinates for representing a point on the graph sheet.
The process of fixing a point with the help of the coordinates is known as ______ of the point.
Match the ordinates of the points given in Column A with the items mentioned in Column B.
| Column A | Column B |
| (a) (7, 0) | (i) The ordinate is double the abscissa. |
| (b) (11, 11) | (ii) The ordinate is zero. |
| (c) (4, 8) | (iii) The ordinate is equal to the abscissa. |
| (d) (6, 2) | (iv) The abscissa is double the ordinate. |
| (e) (0, 9) | (v) The abscissa is triple the ordinate. |
| (f) (6, 3) | (vi) The abscissa is zero. |
The graph given below compares the sales of ice creams of two vendors for a week.
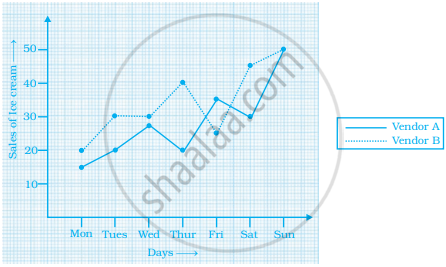
Observe the graph and answer the following questions.
- Which vendor has sold more icecreams on Friday?
- For which day was the sales same for both the vendors?
- On which day did the sale of vendor A increase the most as compared to the previous day?
- On which day was the difference in sales the maximum?
- On which two days was the sales same for vendor B?
Extend the line segment on both sides to meet the coordinate axes. What are the coordinates of the points where this line meets the x-axis and the y-axis?
A man started his journey on his car from location A and came back. The given graph shows his position at different times during the whole journey.
- At what time did he start and end his journey?
- What was the total duration of journey?
- Which journey, forward or return, was of longer duration?
- For how many hours did he not move?
- At what time did he have the fastest speed?
The points on the graph below represent the height and weight of the donkey, dog, crocodile, and ostrich shown in the drawing.

- What are the two variables represented in the graph?
- Which point represents each animals? Explain.
