Advertisements
Advertisements
प्रश्न
Decide which of the following statements is true and which is false. Give reasons for your answer.
A point whose y-coordinate is zero, will lie on x-axis.
Advertisements
उत्तर
The examples of points having y-coordinate as zero are (3,0), (6,0), (9,0). This can be represented in the following manner:
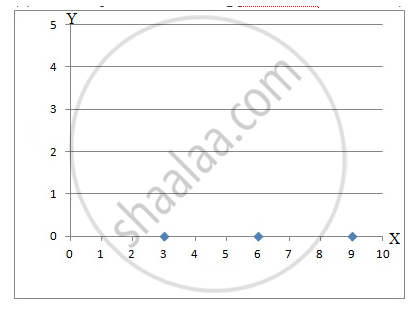
From figure above, it can be seen that these points lie on the x-axis. Hence, the statement is true.
संबंधित प्रश्न
Write the coordinates of each of the vertices of each polygon in Fig. 27.9.

The following table gives the information regarding the number of persons employed to a piece of work and time taken to complete the work:
| Number of persons: | 2 | 4 | 6 | 8 |
| Time taken (in days): | 12 | 6 | 4 | 3 |
Plot a graph of this information.
The point (3, 4) is at a distance of ______.
For the point (5, 2), the distance from the x-axis is ______ units.
The x-coordinate of any point lying on the y-axis will be ______.
For fixing a point on the graph sheet we need two coordinates.
Plot the given points on a graph sheet and check if the points lie on a straight line. If not, name the shape they form when joined in the given order.
(1, 1), (1, 2), (2, 1), (2, 2)
Plot the given points on a graph sheet and check if the points lie on a straight line. If not, name the shape they form when joined in the given order.
(4, 2), (2, 4), (3, 3), (5, 4)
