मराठी

The x-coordinate of any point lying on the y-axis will be ______.

Advertisements
Advertisements

प्रश्न

The x-coordinate of any point lying on the y-axis will be ______.

रिकाम्या जागा भरा
Advertisements

उत्तर

The x-coordinate of any point lying on the y-axis will be zero.

Explanation:

Since, the x-coordinate represents the distance of the point from y-axis is zero, therefore the points lying on the y-axis have x-coordinate as zero.

shaalaa.com
  या प्रश्नात किंवा उत्तरात काही त्रुटी आहे का?
पाठ 12: Introduct To Graphs - Exercise [पृष्ठ ३७५]

APPEARS IN

एनसीईआरटी एक्झांप्लर Mathematics Exemplar [English] Class 8
पाठ 12 Introduct To Graphs
Exercise | Q 20. | पृष्ठ ३७५

व्हिडिओ ट्यूटोरियलVIEW ALL [1]

संबंधित प्रश्‍न

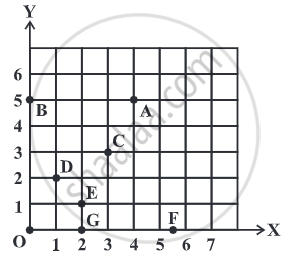
From Fig, choose the letter(s) that indicate the location of the points given below:
(i) (2, 1)
(ii) (0, 5)
(iii) (2, 0)
Also, write
(iv) The coordinates of A.
(v) The coordinates of F.

In the given figure the position of the book on the table may be given by ______.


From the given graph, choose the letters that indicate the location of the points given below.

  1. (2, 0)
  2. (0, 4)
  3. (5, 1)
  4. (2, 6)
  5. (3, 3)

Study the graph given below of a person who started from his home and returned at the end of the day. Answer the questions that follow.

  1. At what time did the person start from his home?
  2. How much distance did he travel in the first four hours of his journey?
  3. What was he doing from 3 pm to 5 pm?
  4. What was the total distance travelled by him throughout the day?
  5. Calculate the distance covered by him in the first 8 hours of his journey.
  6. At what time did he cover 16 km of his journey?
  7. Calculate the average speed of the man from (a) A to B (b) B to C.
  8. At what time did he return home?

Locate the points A(1, 2), B(4, 2) and C(1, 4) on a graph sheet taking suitable axes. Write the coordinates of the fourth point D to complete the rectangle ABCD.


The table given below shows the temperatures recorded on a day at different times.
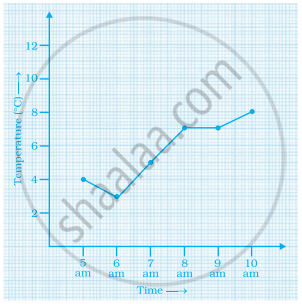

Observe the table and answer the following questions.

  1. What is the temperature at 8 am?
  2. At what time is the temperature 3°C?
  3. During which hour did the temperature fall?
  4. What is the change in temperature between 7 am and 10 am?
  5. During which hour was there a constant temperature?

The following table gives the growth chart of a child.

Height (in cm) 75 90 110 120 130
Age (in years) 2 4 6 8 10

Draw a line graph for the table and answer the questions that follow.

  1. What is the height at the age of 5 years?
  2. How much taller was the child at the age of 10 than at the age of 6?
  3. Between which two consecutive periods did the child grow more faster?

Ajita starts off from home at 07.00 hours with her father on a scooter that goes at a uniform speed of 30 km/h and drops her at her school after half an hour. She stays in the school till 13.30 hours and takes an auto-rickshaw to return home. The rickshaw has a uniform speed of 10 km/h. Draw the graph for the above situation and also determine the distance of Ajita’s school from her house.


The graph given below compares the price (in Rs) and weight of 6 bags (in kg) of sugar of different brands A, B, C, D, E, F.

  1. Which brand(s) costs/cost more than Brand D?
  2. Bag of which brand of sugar is the heaviest?
  3. Which brands weigh the same?
  4. Which brands are heavier than brand B?
  5. Which bag is the lightest?
  6. Which bags are of the same price?

The two graphs below compare Car A and Car B. The left graph shows the relationship between age and value. The right graph shows the relationship between size and maximum speed.

Use the graphs to determine whether each statement is true or false, and explain your answer.

  1. The older car is less valuable.
  2. The faster car is larger.
  3. The larger car is older.
  4. The faster car is older.
  5. The more valuable car is slower.

Share
Notifications

Englishहिंदीमराठी


      Forgot password?
Use app×