Advertisements
Advertisements
प्रश्न
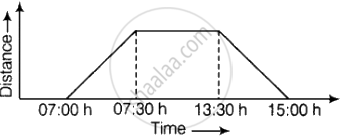
Ajita starts off from home at 07.00 hours with her father on a scooter that goes at a uniform speed of 30 km/h and drops her at her school after half an hour. She stays in the school till 13.30 hours and takes an auto-rickshaw to return home. The rickshaw has a uniform speed of 10 km/h. Draw the graph for the above situation and also determine the distance of Ajita’s school from her house.
Advertisements
उत्तर
Uniform speed of Ajita’s father on scooter = 30 km/h
Time taken by her father to drop Ajita to her school = `1/2`h on 30 min
∴ Distance between Ajita’s school and her home = `30 xx 1/2`= 15 km ...[∵ Distance = Speed × Time]
Distance cover in 1 min = `15/30`
= `1/2` km
= 500 m
APPEARS IN
संबंधित प्रश्न
Locate the points:
(1, 4), (2, 4), (3, 4), (4, 4).
Decide which of the following statements is true and which is false. Give reasons for your answer.
A point whose y-coordinate is zero, will lie on x-axis.
The x-coordinate of any point lying on the y-axis will be ______.
For fixing a point on the graph sheet we need two coordinates.
The ordinate of a point is its distance from the y-axis.
Write the x-coordinate (abscissa) of the given point.
(7, 3)
Find the coordinates of the vertices of the given figures.

This graph shows the per cent of students who dropped out of school after completing High School. The point labelled A shows that, in 1996, about 4.7% of students dropped out.

- In which year was the dropout the rate highest? In which year was it the lowest?
- When did the per cent of students who dropped out of high school first fall below 5%?
- About what per cent of students dropped out of high school in 2007? About what per cent of students stayed in high school in 2008?
