Advertisements
Advertisements
प्रश्न
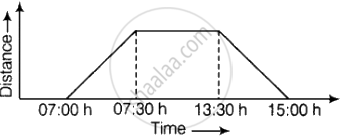
Ajita starts off from home at 07.00 hours with her father on a scooter that goes at a uniform speed of 30 km/h and drops her at her school after half an hour. She stays in the school till 13.30 hours and takes an auto-rickshaw to return home. The rickshaw has a uniform speed of 10 km/h. Draw the graph for the above situation and also determine the distance of Ajita’s school from her house.
Advertisements
उत्तर
Uniform speed of Ajita’s father on scooter = 30 km/h
Time taken by her father to drop Ajita to her school = `1/2`h on 30 min
∴ Distance between Ajita’s school and her home = `30 xx 1/2`= 15 km ...[∵ Distance = Speed × Time]
Distance cover in 1 min = `15/30`
= `1/2` km
= 500 m
APPEARS IN
संबंधित प्रश्न
Plot the following points on a graph sheet. Verify if they lie on a line
A(4, 0), B(4, 2), C(4, 6), D(4, 2.5)
Find the coordinates of points A, B, C, D in Fig. 27.7.

Decide which of the following statements is true and which is false. Give reasons for your answer.
The coordinates of the origin are (0, 0).
The point (3, 4) is at a distance of ______.
In the point (4, 7), 4 denotes the ______.
In the coordinates of a point, the second number denotes the ______.
From the given graph, choose the letters that indicate the location of the points given below.

- (2, 0)
- (0, 4)
- (5, 1)
- (2, 6)
- (3, 3)
Write the x-coordinate (abscissa) of the given point.
(5, 7)
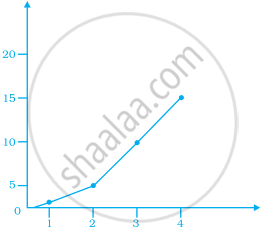
Observe the given graph carefully and complete the table given below.
| x | 1 | 2 | 3 | 4 | 5 |
| y |
The graph given below compares the price (in Rs) and weight of 6 bags (in kg) of sugar of different brands A, B, C, D, E, F.

- Which brand(s) costs/cost more than Brand D?
- Bag of which brand of sugar is the heaviest?
- Which brands weigh the same?
- Which brands are heavier than brand B?
- Which bag is the lightest?
- Which bags are of the same price?
