Advertisements
Advertisements
प्रश्न
Plot the following points on a graph sheet. Verify if they lie on a line
A(4, 0), B(4, 2), C(4, 6), D(4, 2.5)
Advertisements
उत्तर
We can plot the given points and join the consecutive points on a graph paper as follows.
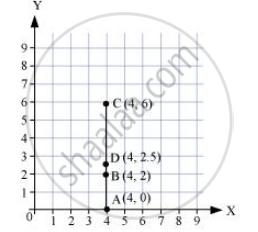
From the graph, it can be observed that the points A, B, C, and D lie on the same line.
संबंधित प्रश्न
Locate the points:
(2, 1), (2, 2), (2, 3), (2, 4)
Find the coordinates of points P, Q, R and S in Fig. 27.8.

The distance of the point (3, 5) from the y-axis is 5.
Plot the given points on a graph sheet and check if the points lie on a straight line. If not, name the shape they form when joined in the given order.
(1, 1), (1, 2), (2, 1), (2, 2)
If y-coordinate is 3 times x-coordinate, form a table for it and draw a graph.
Locate the points A(1, 2), B(3, 4) and C(5, 2) on a graph sheet taking suitable axes. Write the coordinates of the fourth point D to complete the rhombus ABCD. Measure the diagonals of this rhombus and find whether they are equal or not.
The following table gives the growth chart of a child.
| Height (in cm) | 75 | 90 | 110 | 120 | 130 |
| Age (in years) | 2 | 4 | 6 | 8 | 10 |
Draw a line graph for the table and answer the questions that follow.
- What is the height at the age of 5 years?
- How much taller was the child at the age of 10 than at the age of 6?
- Between which two consecutive periods did the child grow more faster?
The following is the time-distance graph of Sneha’s walking.

- When does Sneha make the least progress? Explain your reasoning.
- Find her average speed in km/hour.
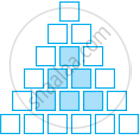
Sonal and Anmol made a sequence of tile designs from square white tiles surrounding one square purple tile. The purple tiles come in many sizes. Three of the designs are shown below.
(a) Copy and complete the table
| Side Length of Purple Titles | 1 | 2 | 3 | 4 | 5 | 10 | 100 |
| Number of white Tiles in Border |
 |
 |
 |
(b) Draw a graph using the first five pairs of numbers in your table.
(c) Do the points lie on a line?
Sonal and Anmol then made another sequence of the designs. Three of the designs are shown below.
 |
 |
 |
(a) Complete the table.
| Rows, r | 4 | 6 | 8 |
| Number of white Tiles, w | 9 | ||
| Number of Purple Tiles, p | 1 |
(b) Draw a graph of rows and number of white tiles. Draw another graph of the number of rows and the number of purple tiles. Put the number of rows on the horizontal axis.
(c) Which graph is linear?
